


08
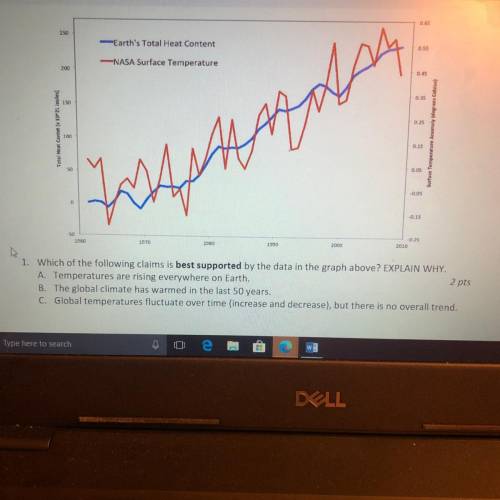
250
-Earth's Total Heat Content
-NASA Surface Temperature
200
150
...

08
250
-Earth's Total Heat Content
-NASA Surface Temperature
200
150
0.25
Total Heat Conte (10^1 lules!
100
0.15
Surfemmes
дулаад,
0 0
0.01
1960
1970
1980
190
2000
2010
1. Which of the following claims is best supported by the data in the graph above? EXPLAIN WHY.
A. Temperatures are rising everywhere on Earth.
2 pts
B. The global climate has warmed in the last 50 years.
C. Global temperatures fluctuate over time (increase and decrease), but there is no overall trend.

Answers: 1
Other questions on the subject: Chemistry
Chemistry, 22.06.2019 07:10, angellong94
Provide a stepwise curved arrow mechanism that fully explains the outcome of the reaction shown below. oh нао* heat он
Answers: 2
Chemistry, 22.06.2019 10:00, paynedeforest2596
According to the tide table below what time of day will the highest tide occur? (2 pt) the highest tide will occur at
Answers: 1
Do you know the correct answer?
Questions in other subjects:


Mathematics, 22.08.2019 02:30

Biology, 22.08.2019 02:30


Mathematics, 22.08.2019 02:30
Mathematics, 22.08.2019 02:30
Mathematics, 22.08.2019 02:30


