


Select the correct answer.
What inference can be drawn from the graph?
a graph of react...

Chemistry, 23.11.2020 03:20, asiamuhammad6
Select the correct answer.
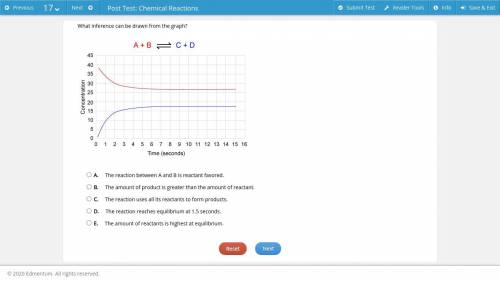
What inference can be drawn from the graph?
a graph of reactant and product concentration vs. time; a red curve shows the reactant decreasing and a blue curve shows the product concentration increasing over time; the two curves do not intersect; the chemical equation shows A + B reacting to produce C + D
A.
The reaction between A and B is reactant favored.
B.
The amount of product is greater than the amount of reactant.
C.
The reaction uses all its reactants to form products.
D.
The reaction reaches equilibrium at 1.5 seconds.
E.
The amount of reactants is highest at equilibrium.

Answers: 2
Other questions on the subject: Chemistry
Chemistry, 22.06.2019 06:10, gabriellestaleyga16
How many moles of gas are present if p=11 atm, v=12l, t=185k?
Answers: 1
Chemistry, 22.06.2019 09:30, jewelz5887
1. explain hydrogen peroxide, h 2 o 2 properties and decomposition reaction. 2. describe how each of the following natural cycles plays a part in earth’s climate system. (a) the water cycle (b) the carbon cycle
Answers: 1
Do you know the correct answer?
Questions in other subjects:

Biology, 22.11.2020 20:00

Mathematics, 22.11.2020 20:00
Mathematics, 22.11.2020 20:00


English, 22.11.2020 20:00

Arts, 22.11.2020 20:00


