

Chemistry, 22.07.2020 20:01, cassandramanuel
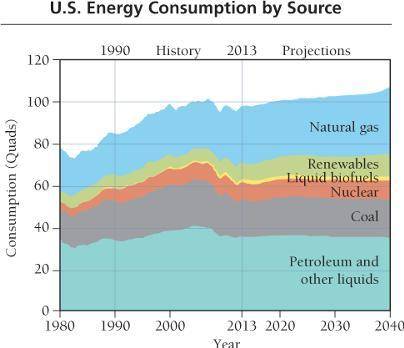
The graph at right shows U. S. energy consumption by source from 1980 to 2040 (based on projections). The consumption is measured in quadrillion BTUs or quads (1 quad = 1.055×10¹⁸ J). a. What were the three largest sources of U. S. energy in 2013 in descending order? What total percent of U. S. energy do these three sources provide? b. What percent of total U. S. energy is provided by renewables in 2013? c. Which two sources of U. S. energy decline as a percentage of total energy use between 1989 and 2040 (based on projections)? d. How much U. S. energy (in joules) was produced by nuclear power in 1990?

Answers: 2


Other questions on the subject: Chemistry
Chemistry, 22.06.2019 14:00, coylenoah0
How many absorptions would you expect to observe in the 13c nmr spectra of the following molecules? a) 3-chloropentane b) cis-4-methyl-2-pentene
Answers: 2
Chemistry, 22.06.2019 19:30, dorindaramirez0531
Which liquid (h2o, h2o + soap, or h2o + salt) has the strongest cohesion and adhesion? (need now plz)
Answers: 1
Chemistry, 23.06.2019 00:30, kylee65
What are the advantages of using the metric system? designed as a decimal system making conversions simpler more accurate system of measurement has prefixes that correspond to an amount to use with all base units used by the entire scientific community
Answers: 2
Chemistry, 23.06.2019 02:30, erikacastro259
what is your question? collegechemistry 5+3 pts in november 1987, a massive iceberg broke loose from the antartic ice mass and floated free in the ocean. the chunk of ice was estimated to be 98 mi long, 25 mi wide, and 750 ft thick. a typical backyard swimming pool contains about 24,000 gallons of water. how many of these pools could you fill from the water in this iceberg? (assume the iceberg is a rectangular solid of the above dimensions and consists of water only). express answer in scientific notation.
Answers: 3
Do you know the correct answer?
The graph at right shows U. S. energy consumption by source from 1980 to 2040 (based on projections)...
Questions in other subjects:
Chemistry, 11.07.2019 23:00


Biology, 11.07.2019 23:00
Biology, 11.07.2019 23:00
Mathematics, 11.07.2019 23:00
Social Studies, 11.07.2019 23:00


