

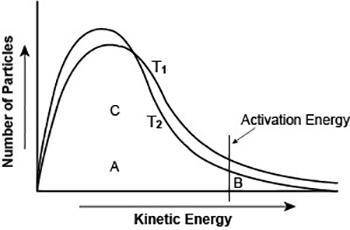
The graph shows the distribution of energy in the particles of two gas samples at different temperatures, T1 and T2. A, B, and C represent individual particles.
Based on the graph, which of the following statements is likely to be true?
A. Particle A is more likely to participate in the reaction than particle B.
B. Particle C is more likely to participate in the reaction than particle B.
C. The number of particles able to undergo a chemical reaction is less than the number that is not able to.
D. More gas particles participate in the reaction at T2 than at T1.

Answers: 2


Other questions on the subject: Chemistry
Chemistry, 21.06.2019 16:00, shamayajohnsonsh5
One of the cell membrane's functions is to protect the cell keep wastes in the cell create new cells keep light out of the cell
Answers: 1
Chemistry, 22.06.2019 05:30, palcochran1313
Describe the interaction that occurs between two objects with the same electrical charge.
Answers: 1
Chemistry, 22.06.2019 08:30, kkelley9223
How would the number of moles (n) of o2 change if the atmospheric pressure doubled but all other variables stayed the same
Answers: 2
Chemistry, 22.06.2019 11:30, ashleybarrera2000
For each of the following compounds, decide whether the compound's solubility in aqueous solution changes with ph. if the solubility does change, pick the ph at which you'd expect the highest solubility. you'll find ksp data in the aleks data tab. compounds does solubility change with ph
Answers: 3
Do you know the correct answer?
The graph shows the distribution of energy in the particles of two gas samples at different temperat...
Questions in other subjects:


Biology, 31.08.2021 22:10

Mathematics, 31.08.2021 22:10
Mathematics, 31.08.2021 22:10


