

The graph shows the distribution of energy in the particles of two gas samples at different temperatures, T1 and T2. A, B, and C represent individual particles.
Based on the graph, which of the following statements is likely to be true? (3 points)
Particle A is more likely to participate in the reaction than particle B.
Particle C is more likely to participate in the reaction than particle B.
The number of particles able to undergo a chemical reaction is less than the number that is not able to.
More gas particles participate in the reaction at T2 than at T1.
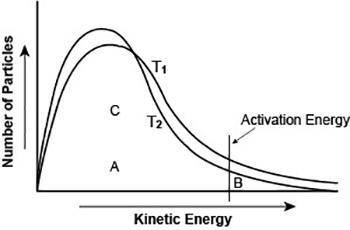

Answers: 3


Other questions on the subject: Chemistry
Chemistry, 22.06.2019 22:30, arodavoarodavo
Which is a characteristic of the electron sea model for metallic bonding? molecular orbitals overlap to produce bands. electrons flow easily between metal nuclei. electrons are in fixed positions in the orbitals. atomic nuclei are arranged in an irregular pattern.
Answers: 3
Chemistry, 23.06.2019 01:30, jonmorton159
At a certain temperature the rate of this reaction is first order in hi with a rate constant of : 0.0632s2hig=h2g+i2g suppose a vessel contains hi at a concentration of 1.28m . calculate how long it takes for the concentration of hi to decrease to 17.0% of its initial value. you may assume no other reaction is important. round your answer to 2 significant digits.
Answers: 1
Do you know the correct answer?
The graph shows the distribution of energy in the particles of two gas samples at different temperat...
Questions in other subjects:

Mathematics, 16.04.2020 22:53

English, 16.04.2020 22:53


Biology, 16.04.2020 22:53
English, 16.04.2020 22:53


