

Chemistry, 22.01.2020 18:31, adrian1742
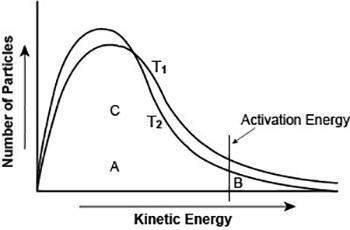
The graph shows the distribution of energy in the particles of two gas samples at different temperatures, t1 and t2. a, b, and c represent individual particles.
based on the graph, which of the following statements is likely to be true?
particle b is more likely to participate in the reaction than particle a.
particle c is more likely to participate in the reaction than particle b.
most of the gas particles have either very high or very low kinetic energies.
more gas particles participate in the reaction at t2 than at t1.

Answers: 2


Other questions on the subject: Chemistry
Chemistry, 22.06.2019 05:30, mandy9386
You are making a solution of calcium chloride dissolved in water. you add solid, stir, and it dissolves. you add just a spatula tip full, stir, and the solid does not dissolve. how could you describe the solutions before and after adding the spatula tip amount
Answers: 1
Chemistry, 22.06.2019 10:10, veronica022
Stage in which a typical star has completely stopped fusion
Answers: 1
Do you know the correct answer?
The graph shows the distribution of energy in the particles of two gas samples at different temperat...
Questions in other subjects:

Mathematics, 29.07.2021 22:40
Mathematics, 29.07.2021 22:40
Mathematics, 29.07.2021 22:40

English, 29.07.2021 22:40
Mathematics, 29.07.2021 22:40

Mathematics, 29.07.2021 22:40


