

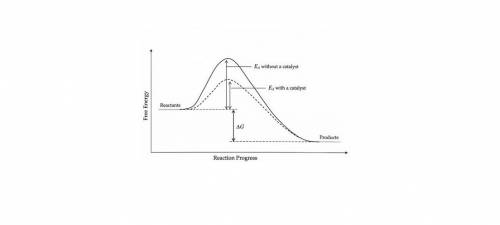
Which of the following phase diagrams represents how a catalyst is able to change the rate of a reaction? (2 points) a regular exothermic potential energy diagram is shown, with a dotted line representing how the potential energy diagram changes with the use of a catalyst. the dotted line shows a new potential energy diagram with two potential energy hills, instead of the one hill in the regular potential energy diagram. a regular exothermic potential energy diagram is shown, with a dotted line representing how the potential energy diagram changes with the use of a catalyst. the dotted line shows a new potential energy diagram with a taller activation energy hill than that in the original potential energy diagram. a regular exothermic potential energy diagram is shown, with a dotted line representing how the potential energy diagram changes with the use of a catalyst. the dotted line shows a new potential energy diagram with two activation energy hills, the second taller than the first, instead of the one hill in the regular potential energy diagram. a regular exothermic potential energy diagram is shown, with a dotted line representing how the potential energy diagram changes with the use of a catalyst. the dotted line shows a new potential energy diagram with a shorter activation energy hill than that in the original potential energy diagram.

Answers: 3


Similar questions
Chemistry, 26.06.2019 18:30, gracerich
Answers: 1
Chemistry, 27.06.2019 07:00, reannalovestodpdn8d2
Answers: 1
Chemistry, 28.07.2019 01:30, mallyosburn
Answers: 1
Do you know the correct answer?
Which of the following phase diagrams represents how a catalyst is able to change the rate of a reac...
Questions in other subjects:


Health, 17.02.2021 03:10

Mathematics, 17.02.2021 03:10


