


Question 18 (2 points)
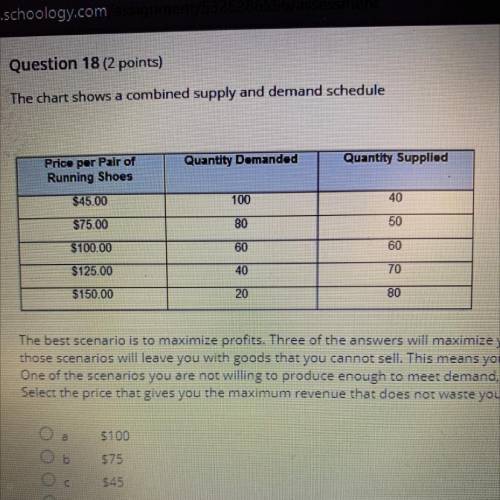
The chart shows a combined supply and demand schedule
The best...

Question 18 (2 points)
The chart shows a combined supply and demand schedule
The best scenario is to maximize profits. Three of the answers will maximize your revenues if you only look at total revenues. However, one. of
those scenarios will leave you with goods that you cannot sell. This means you will have used resources that you could have saved in profits.
One of the scenarios you are not willing to produce enough to meet demand, meaning that you will not actually collect all of the revenue.
Select the price that gives you the maximum revenue that does not waste your resources.
A.$100
B.$75
C.$45
D.$125

Answers: 1
Other questions on the subject: Business
Business, 22.06.2019 12:00, kaylallangari549
In the united states, one worker can produce 10 tons of steel per day or 20 tons of chemicals per day. in the united kingdom, one worker can produce 5 tons of steel per day or 15 tons of chemicals per day. the united kingdom has a comparative advantage in the production of:
Answers: 2
Business, 22.06.2019 22:10, ggg509
Which of the following tends to result in a decrease in the selling price of houses in an area? a. an increase in the population of the city or town. b. an increase in the labor costs of construction. c. an increase in the income of new residents in the city or town. d. an increase in mortgage interest rates.
Answers: 1
Business, 23.06.2019 03:20, sabrinaunderhillx
Bathlinks corporation has a debt to assets ratio of 73%. this tells the user of bathlinks’s financial statements that a. bathlinks is getting a 27% return on its assets. b. there is a risk that bathlinks cannot pay its debts as they come due. c. 73% of the assets are financed by the stockholders. d. based on this measure, the user should not invest in bathlinks.
Answers: 3
Business, 23.06.2019 16:30, willwhitlock803
5. real versus nominal gdp consider a simple economy that produces two goods: cupcakes and muffins. the following table shows the prices and quantities of the goods over a three-year period. year cupcakes muffins price quantity price quantity (dollars per cupcake) (number of cupcakes) (dollars per muffin) (number of muffins) 2014 2 115 5 175 2015 4 150 2 180 2016 1 100 2 160 use the information from the preceding table to fill in the following table. year nominal gdp real gdp gdp deflator (dollars) (base year 2014, dollars) 2014 2015 2016 from 2015 to 2016, nominal gdp , and real gdp . the inflation rate in 2016 was . why is real gdp a more accurate measure of an economy's production than nominal gdp? real gdp does not include the value of intermediate goods and services, but nominal gdp does. real gdp measures the value of the goods and services an economy produces, but nominal gdp measures the value of the goods and services an economy consumes. real gdp is not influenced by price changes, but nominal gdp is.
Answers: 1
Do you know the correct answer?
Questions in other subjects:

Biology, 03.06.2020 20:57


Mathematics, 03.06.2020 20:58

Chemistry, 03.06.2020 20:58

Mathematics, 03.06.2020 20:58
Mathematics, 03.06.2020 20:58
Mathematics, 03.06.2020 20:58


