

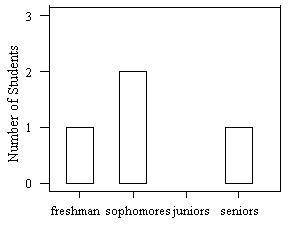
(1 point) Below is a bar graph of class standing for a Finance seminar containing five students who are either freshman, sophomores, juniors, or seniors. In the bar graph the bar for the juniors has been omitted. ( Click on the image for a larger view. )
(a) The percentage of students in the seminar who are not juniors is?
A. 60%
B. 40%
C. 20%
D. 80%
E. None of the above.
(b) The number of students in the seminar who are juniors is

Answers: 1


Other questions on the subject: Business
Business, 22.06.2019 15:00, shakaylaousley1997
Portia grant is an employee who is paid monthly. for the month of january of the current year, she earned a total of $8,388. the fica tax for social security is 6.2% of the first $118,500 earned each calendar year and the fica tax rate for medicare is 1.45% of all earnings. the futa tax rate of 0.6% and the suta tax rate of 5.4% are applied to the first $7,000 of an employee's pay. the amount of federal income tax withheld from her earnings was $1,391.77. what is the total amount of taxes withheld from the portia's earnings?
Answers: 2
Business, 22.06.2019 17:50, pickles3233
The management of a supermarket wants to adopt a new promotional policy of giving a free gift to every customer who spends > a certain amount per visit at this supermarket. the expectation of the management is that after this promotional policy is advertised, the expenditures for all customers at this supermarket will be normally distributed with a mean of $95 and a standard deviation of $20. if the management wants to give free gifts to at most 10% of the customers, what should the amount be above which a customer would receive a free gift?
Answers: 1
Business, 22.06.2019 21:10, chrisraptorofficial
This problem has been solved! see the answerthe xyz corporation is interested in possible differences in days worked by salaried employees in three departments in the financial area. a survey of 23 randomly chosen employees reveals the data shown below. because of the casual sampling methodology in this survey, the sample sizes are unequal. research question: are the mean annual attendance rates the same for employees in these three departments? days worked last year by 23 employees department days worked budgets (5 workers) 278 260 265 245 258 payables (10 workers) 205 270 220 240 255 217 266 239 240 228 pricing (8 workers) 240 258 233 256 233 242 244 249 picture click here for the excel data filefill in the missing data. (round your p-value to 4 decimal places, mean values to 1 decimal place and other answers to 2group mean n std. dev variancesbudgets payables pricing total one factor anova source ss df ms f p-value treatment error total
Answers: 2
Do you know the correct answer?
(1 point) Below is a bar graph of class standing for a Finance seminar containing five students who...
Questions in other subjects:


Mathematics, 09.12.2020 03:50


Mathematics, 09.12.2020 03:50
Mathematics, 09.12.2020 03:50


