


On this graph the top horizontal line represents
1. A price floor set above equilibrium
2. A...

Business, 26.01.2021 19:10, isaiahmyers3410
On this graph the top horizontal line represents
1. A price floor set above equilibrium
2. A price floor set below equilibrium
3. A price ceiling set above equilibrium
4. A price ceiling set below equilibrium
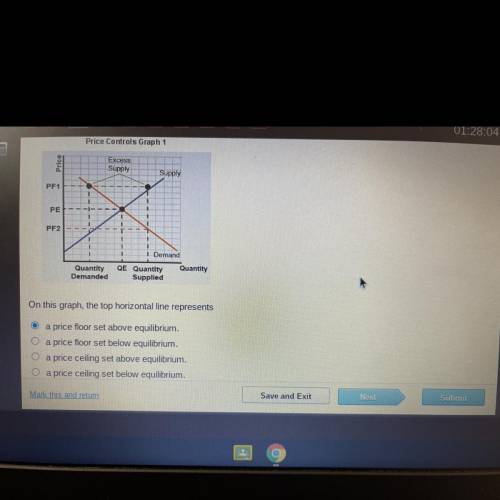

Answers: 2
Other questions on the subject: Business
Business, 21.06.2019 15:00, natalie2sheffield
Landon mars, the company bookkeeper, recorded the $10,000 purchase of land as rent expense by decreasing cash and decreasing shareholders' equity. what is the effect of this error on the accounting equation
Answers: 2
Business, 21.06.2019 20:40, stephanie37766
Ail industries uses activity-based costing to assist management in setting prices for the company's three major product lines. the following information is available: activity cost pool estimated overhead expected use of cost driver per activity cutting $1,000,000 25,000 labor hours stitching 8,000,000 320,000 machine hours inspections 2,800,000 160,000 labor hours packing 960,000 64,000 finished goods units compute the activity-based overhead rates. (round answers to 2 decimal places, e. g. 12.25.)
Answers: 2
Business, 22.06.2019 02:40, ItzJuztWillie
The following accounts are denominated in pesos as of december 31, 2015. for reporting purposes, these amounts need to be stated in u. s. dollars. for each balance, indicate the exchange rate that would be used if a translation is made under the current rate method. then, again for each account, provide the exchange rate that would be necessary if a remeasurement is being made using the temporal method. the company was started in 2000. the buildings were acquired in 2002 and the patents in 2003. (round your answers to 2 decimal places.) exchange rates for 1 peso are as follows: 2000 1 peso = $ 0.28 2002 1 = 0.26 2003 1 = 0.25 january 1, 2015 1 = 0.24 april 1, 2015 1 = 0.23 july 1, 2015 1 = 0.22 october 1, 2015 1 = 0.20 december 31, 2015 1 = 0.16 average for 2015 1 = 0.19
Answers: 3
Business, 22.06.2019 12:10, felisha1234
Bonds often pay a coupon twice a year. for the valuation of bonds that make semiannual payments, the number of periods doubles, whereas the amount of cash flow decreases by half. using the values of cash flows and number of periods, the valuation model is adjusted accordingly. assume that a $1,000,000 par value, semiannual coupon us treasury note with three years to maturity has a coupon rate of 3%. the yield to maturity (ytm) of the bond is 7.70%. using this information and ignoring the other costs involved, calculate the value of the treasury note:
Answers: 1
Do you know the correct answer?
Questions in other subjects:

Mathematics, 24.06.2019 05:30
Mathematics, 24.06.2019 05:30


Mathematics, 24.06.2019 05:30
History, 24.06.2019 05:30
Business, 24.06.2019 05:30


