


Answers: 2


Other questions on the subject: Business
Business, 22.06.2019 00:30, krystlemiller4307
A) plot the m1 and m2 money stock in the us from 1990-2015. (hint: you may use the data tools provided by fred.) (b) plot the nominal interest rate from 1960 to 2014. (hint: you can either use the daily interest rates for selected u. s. treasury, private money market and capital market instruments from or the effective federal funds rate fromfred.) (c) the consumer price index (cpi) is a measure of the average change over time in the prices paid by urban consumers for a market basket of consumer goods and services. intuitively, the cpi represents the cost of living or the average price level. plot the cpi from 1960 to 2013.(d) the inflation rate is the yearly percentage change in the average price level. in practice, we usually use the percentage change in the cpi to compute the inflation rate. plot the inflation rate from 1960 to 2013.(e) explain the difference between the ex-ante and ex-post real interest rate. use the fisher equation to compute the ex-post real interest rate. plot the nominal interest rate and the ex-post real interest rate from 1960 to 2013 in the same graph.
Answers: 3
Business, 22.06.2019 20:20, nicky123415
Amanager of a store that sells and installs spas wants to prepare a forecast for january and june of next year. her forecasts are a combination of trend and seasonality. she uses the following equation to estimate the trend component of monthly demand: ft = 30+5t, where t = 1 in january of this year. seasonal relatives are 0.60 for january and 1.50 for june. what demands should she predict for january and june of next year
Answers: 2
Business, 23.06.2019 15:30, amberwithnell12512
10. problems and applications q10 a market is described by the following supply-and-demand curves: qsqs = = 2p2p qdqd = = 300â’p300â’p the equilibrium price is $ and the equilibrium quantity is . suppose the government imposes a price ceiling of $90. this price ceiling is , and the market price will be $ . the quantity supplied will be , and the quantity demanded will be . therefore, a price ceiling of $90 will result in . suppose the government imposes a price floor of $90. this price floor is , and the market price will be $ . the quantity supplied will be and the quantity demanded will be . therefore, a price floor of $90 will result in . instead of a price control, the government levies a tax on producers of $30. as a result, the new supply curve is: qsqs = = 2(pâ’30)2pâ’30 with this tax, the market price will be $ , the quantity supplied will be , and the quantity demanded will be . the passage of such tax will result in .
Answers: 1
Do you know the correct answer?
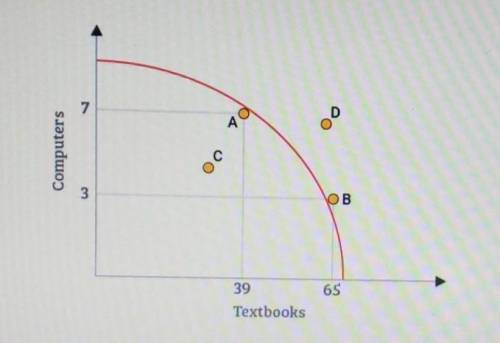
Which points on the production possibilities curve show a level of production that would be achievab...
Questions in other subjects:


Chemistry, 04.07.2019 00:30


