

Business, 12.01.2021 09:40, rosepotato789
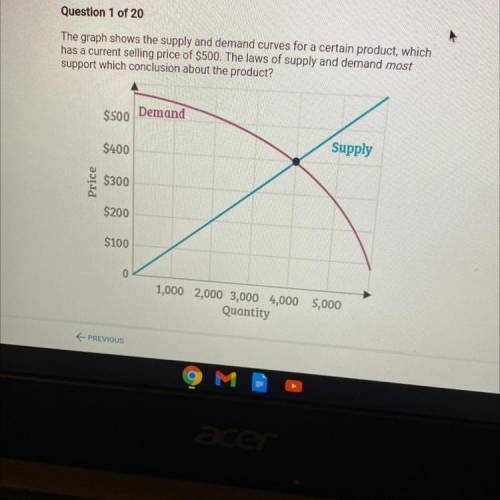
The graph shows the supply and demand curves for a certain product, which
has a current selling price of $500. The laws of supply and demand most
support which conclusion about the product?
$500
Demand
Supply
$400
Price
$300
$200
$100
0
1,000 2,000 3,000 4,000 5,000
Quantity

Answers: 3


Other questions on the subject: Business
Business, 21.06.2019 17:20, keshonerice
Luis and rosa, citizens of costa rica, moved to the united states in year 1 where they both lived and worked. in year 3, they provided the total support for their four young children (all under the age of 10). two children lived with luis and rosa in the u. s., one child lived with his aunt in mexico, and one child lived with her grandmother in costa rica. none of the children earned any income. all of the children were citizens of costa rica. the child in mexico was a resident of mexico, and the child in costa rica was a resident of costa rica. how many total exemptions (personal exemptions plus exemptions for dependents) may luis and rosa claim on their year 3 joint income tax return? a. 6 b. 5 c. 4 d. 2
Answers: 3
Business, 21.06.2019 19:10, corcoranrobert1959
Goals that are overly ambitious can discourage employees and decrease motivation, yet the idea of stretch goals is proposed as a way to get people fired up and motivated. as a manager, how might you decide where to draw the line between a “good” stretch goal and a “bad” one that is unrealistic?
Answers: 1
Business, 21.06.2019 23:30, probablyacommunist
Using the exxon data as an example what would be the market capitalization of penny's pickles if each share is selling for $175.35?
Answers: 3
Business, 22.06.2019 08:00, leannaadrian
Companies in the u. s. car rental market vary greatly in terms of the size of the fleet, the number of locations, and annual revenue. in 2011 hertz had 320,000 cars in service and annual revenue of approximately $4.2 billion. the following data show the number of cars in service (1000s) and the annual revenue ($ millions) for six smaller car rental companies (auto rental news website, august 7, 2012). excel file: data14-09.xls if required, enter negative values as negative numbers. a. select a scatter diagram with the number of cars in service as the independent variable. b. what does the scatter diagram developed in part (a) indicate about the relationship between the two variables? c. use the least squares method to develop the estimated regression equation (to 3 decimals). ŷ = + x d. for every additional car placed in service, estimate how much annual revenue will change. by $ e. fox rent a car has 11,000 cars in service. use the estimated regression equation developed in part (c) to predict annual revenue for fox rent a car. round your answer to nearest whole value. $ million hide feedback partially correct
Answers: 1
Do you know the correct answer?
The graph shows the supply and demand curves for a certain product, which
has a current selling pri...
Questions in other subjects:


Mathematics, 24.11.2019 01:31

Health, 24.11.2019 01:31


