
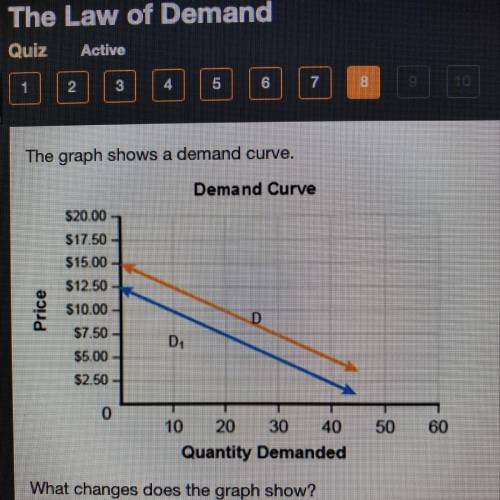


The graph shows a demand curve.
What changes does the graph show?
A. an increase...


Answers: 2
Other questions on the subject: Business
Business, 22.06.2019 02:30, bellamore
Consider the local telephone company, a natural monopoly. the following graph shows the monthly demand curve for phone services and the company’s marginal revenue (mr), marginal cost (mc), and average total cost (atc) curves. 0 2 4 6 8 10 12 14 16 18 20 100 90 80 70 60 50 40 30 20 10 0 price (dollars per subscription) quantity (thousands of subscriptions) d mr mc atc 8, 60 suppose that the government has decided not to regulate this industry, and the firm is free to maximize profits, without constraints. complete the first row of the following table. pricing mechanism short run long-run decision quantity price profit (subscriptions) (dollars per subscription) profit maximization marginal-cost pricing average-cost pricing suppose that the government forces the monopolist to set the price equal to marginal cost. complete the second row of the previous table. suppose that the government forces the monopolist to set the price equal to average total cost. complete the third row of the previous table. under average-cost pricing, the government will raise the price of output whenever a firm’s costs increase, and lower the price whenever a firm’s costs decrease. over time, under the average-cost pricing policy, what will the local telephone company most likely do
Answers: 2
Business, 22.06.2019 11:40, lmiranda5034
Zachary company produces commercial gardening equipment. since production is highly automated, the company allocates its overhead costs to product lines using activity-based costing. the costs and cost drivers associated with the four overhead activity cost pools follow: activities unit level batch level product level facility level cost $ 64,800 $ 27,730 $ 15,000 $ 154,000 cost driver 2,400 labor hrs. 47 setups percentage of use 11,000 units production of 780 sets of cutting shears, one of the company’s 20 products, took 240 labor hours and 7 setups and consumed 15 percent of the product-sustaining activities. required: (a) had the company used labor hours as a company wide allocation base, how much overhead would it have allocated to the cutting shears? (b) how much overhead is allocated to the cutting shears using activity-based costing? (c) compute the overhead cost per unit for cutting shears first using activity-based costing and then using direct labor hours for allocation if 780 units are produced. if direct product costs are $150 and the product is priced at 30 percent above cost for what price would the product sell under each allocation system? (d) assuming that activity-based costing provides a more accurate estimate of cost, indicate whether the cutting shears would be over- or underpriced if direct labor hours are used as an allocation base. explain how over-or undercosting can affect vaulker's profitability. (e) comment on the validity of using the allocated facility-level cost in the pricing decision. should other costs be considered in a cost- plus pricing decision? if so, which ones? what costs would you include if you were trying to decide whether to accept a special order?
Answers: 1
Business, 22.06.2019 15:20, ashleyuchiha123
Gulliver travel agencies thinks interest rates in europe are low. the firm borrows euros at 5 percent for one year. during this time period the dollar falls 11 percent against the euro. what is the effective interest rate on the loan for one year? (consider the 11 percent fall in the value of the dollar as well as the interest payment.)
Answers: 2
Business, 22.06.2019 17:40, lukecoupland4401
Solomon chemical company makes three products, b7, k6, and x9, which are joint products from the same materials. in a standard batch of 320,000 pounds of raw materials, the company generates 70,000 pounds of b7, 150,000 pounds of k6, and 100,000 pounds of x9. a standard batch costs $3,840,000 to produce. the sales prices per pound are $10, $14, and $20 for b7, k6, and x9, respectively. (a) allocate the joint product cost among the three final products using weight as the allocation base. (b) allocate the joint product cost among the three final products using market value as the allocation base. (c) allocate the joint product cost among the three final products using weight as the allocation base.
Answers: 3
Do you know the correct answer?
Questions in other subjects:

Mathematics, 01.08.2019 22:00

History, 01.08.2019 22:00


Mathematics, 01.08.2019 22:00


Biology, 01.08.2019 22:00


