

Business, 24.01.2020 23:31, carterjavon6929
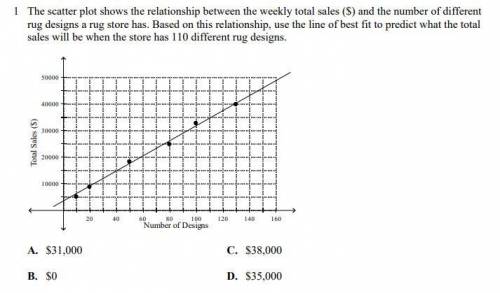
The scatter plot shows the relationship between the weekly total sales ($) and the number of different rug designs a rug store has. based on this relationship, use the line of best fit to predict what the total sales will be when the store has 110 different rug designs.
a. $31,000
b. $38,000
c. $0
d. $35,000

Answers: 2


Other questions on the subject: Business
Business, 22.06.2019 05:30, tommyaberman
Sally is buying a home and the closing date is set for april 20th. the annual property taxes are $1,234.00 and have not been paid yet. using actual days, how much will the buyer be credited and the seller be debited
Answers: 2
Business, 22.06.2019 10:50, lindalu
Choose the statement that is incorrect. a. search activity occurs only in markets where there is a shortage. b. when a price is regulated and there is a shortage, search activity increases. c. the time spent looking for someone with whom to do business is called search activity. d. the opportunity cost of a good is equal to its price plus the value of the search time spent finding the good.
Answers: 3
Business, 22.06.2019 12:30, cuppykittyy
Acorporation a. can use different depreciation methods for tax and financial reporting purposes b. must use the straight - line depreciation method for tax purposes and double declining depreciation method financial reporting purposes c. must use different depreciation method for tax purposes, but strictly mandated depreciation methods for financial reporting purposes d. can use straight- line depreciation method for tax purposes and macrs depreciation method financial reporting purposes
Answers: 2
Business, 22.06.2019 14:00, Kate1678
Wallace company provides the following data for next year: month budgeted sales january $120,000 february 108,000 march 140,000 april 147,000 the gross profit rate is 35% of sales. inventory at the end of december is $29,600 and target ending inventory levels are 10% of next month's sales, stated at cost. what is the amount of purchases budgeted for january?
Answers: 1
Do you know the correct answer?
The scatter plot shows the relationship between the weekly total sales ($) and the number of differe...
Questions in other subjects:


English, 18.11.2020 22:00

Health, 18.11.2020 22:00


Mathematics, 18.11.2020 22:00
Mathematics, 18.11.2020 22:00

Mathematics, 18.11.2020 22:00


