

Business, 09.07.2019 04:30, angelbabynn05
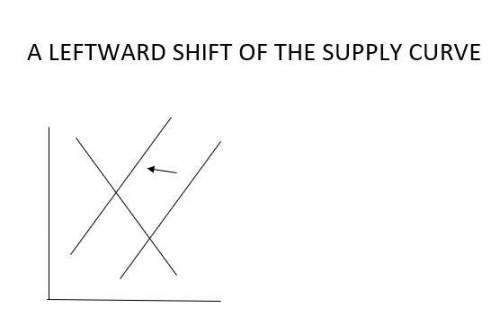
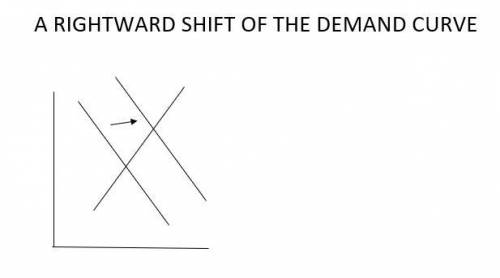
The market price of cheeseburgers in a college town increased recently, and the students in an economics class are debating the cause of the price increase. some students suggest that the price increased because several burger joints in the area have recently gone out of business. other students attribute the increase in the price of cheeseburgers to a recent increase in the price of calzones at local pizza parlors. everyone agrees that the increase in the price of calzones was caused by a recent increase in the price of pizza dough, which is not generally used in making cheeseburgers. assume that burger joints and pizza parlors are entirely separate entities' that is, there aren't places that serve both cheeseburgers and calzones. 1. the first group of students thinks the increase in the price of cheeseburgers is due to the fact that several burger joints in the area have recently gone out of business. on the following graph, adjust the supply and demand curves to illustrate the first groups explanation for the increase in the price of cheeseburgers. i don't have the graphs because i don't know how to input it onto the question but i would like to know the change for each graphs supply and demand lines either to the left or right. 2. the second group of students attributes the increase in the price of cheeseburgers to the increase in the price of calzones at local pizza parlors. on the following graph, adjust the supply and demand curves to illustrate the second group's explanation for the increase in the price of cheeseburgers. 3. suppose that both of the events you analyzed above are partly responsible for the increase in the price of cheeseburgers. based on your analysis of the explanations offered by the two groups of students, how would you figure out which of the possible causes was the dominant cause of the increase in the price of cheeseburgers? a) if the price increase was small, then the supply shift in the market for cheeseburgers must have been larger than the demand shift. b) if the equilibrium quantity of cheeseburgers increases, then the demand shift in the market for cheeseburgers must have been larger than the supply shift. c) if the equilibrium quantity of cheeseburgers increases, then the supply shift in the market for cheeseburgers must have been larger than the demand shift. d) whichever change occurred first must have been the primary cause of the change in the price of cheeseburgers.

Answers: 1


Other questions on the subject: Business
Business, 21.06.2019 20:40, stephanie37766
Ail industries uses activity-based costing to assist management in setting prices for the company's three major product lines. the following information is available: activity cost pool estimated overhead expected use of cost driver per activity cutting $1,000,000 25,000 labor hours stitching 8,000,000 320,000 machine hours inspections 2,800,000 160,000 labor hours packing 960,000 64,000 finished goods units compute the activity-based overhead rates. (round answers to 2 decimal places, e. g. 12.25.)
Answers: 2
Business, 22.06.2019 19:10, boi7348
Pam is a low-risk careful driver and fran is a high-risk aggressive driver. to reveal their driver types, an auto-insurance company a. refuses to insure high-risk drivers b. charges a higher premium to owners of newer cars than to owners of older cars c. offers policies that enable drivers to reveal their private information d. uses a pooling equilibrium e. requires drivers to categorize themselves as high-risk or low-risk on the application form
Answers: 3
Business, 22.06.2019 19:30, smokey19
The usa today reports that the average expenditure on valentine's day is $100.89. do male and female consumers differ in the amounts they spend? the average expenditure in a sample survey of 47 male consumers was $135.67, and the average expenditure in a sample survey of 38 female consumers was $68.64. based on past surveys, the standard deviation for male consumers is assumed to be $34, and the standard deviation for female consumers is assumed to be $17.
Answers: 1
Business, 22.06.2019 23:00, andersonmm22
The sign at the bank reads, "wait here for the first available teller," suggests the use of a waiting line system. a. multiple server, single phaseb. random server, single phasec. single server, multiphased. multiple server, multiphasee. dynamic server, single phase
Answers: 2
Do you know the correct answer?
The market price of cheeseburgers in a college town increased recently, and the students in an econo...
Questions in other subjects:


Mathematics, 30.07.2019 22:00


