

Biology, 28.01.2022 16:50, nathangirnet
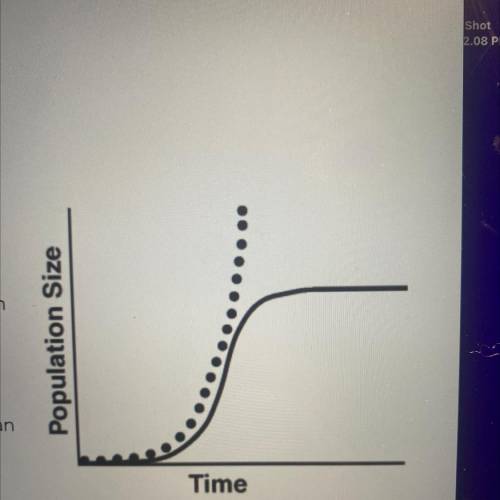
The dotted line on the accompanying graph
represents the potential size of a population based on its
reproductive capacity. The solid line on this graph
represents the actual size of the population.
Which statement best explains why the actual population
growth is less than the potential population growth?
(1 point)
a.
Resources in the environment are limited
b.
More organisms migrated into the population than
out of the population
C.
The birth rate gradually become greater than the
death rate
d.
The final population size is greater than the
carrying capacity

Answers: 1


Other questions on the subject: Biology
Biology, 22.06.2019 04:00, smithscarpetcaour4es
In the water cycle , when does water undergo a chemical change
Answers: 1
Biology, 22.06.2019 04:30, Gerber7778
What maintain homeostasis when a persons internal body temperature is 97.5°f
Answers: 1
Biology, 22.06.2019 11:30, DwayneLeonard618
28. how many linkage groups will be formed by homogametic organism with 28 chromosomes?
Answers: 2
Do you know the correct answer?
The dotted line on the accompanying graph
represents the potential size of a population based on i...
Questions in other subjects:

Mathematics, 27.12.2019 18:31
Mathematics, 27.12.2019 18:31

Mathematics, 27.12.2019 18:31
Mathematics, 27.12.2019 18:31

Biology, 27.12.2019 18:31
Mathematics, 27.12.2019 18:31


