

Biology, 08.10.2021 18:20, asseatingbandit
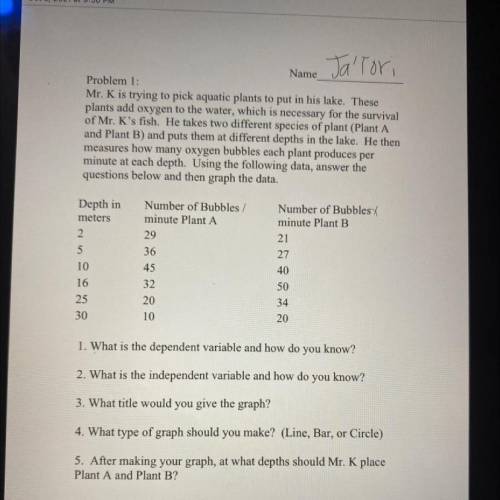
MIT. is trying to pick aquatic plants to put in his lake. These
plants add oxygen to the water, which is necessary for the survival
of Mr. K's fish. He takes two different species of plant (Plant A
and Plant B) and puts them at different depths in the lake. He then
measures how many oxygen bubbles each plant produces per
minute at each depth. Using the following data, answer the
questions below and then graph the data.
Depth in
meters
2
5
Number of Bubbles /
minute Plant A
29
36
45
32
20
Number of Bubbles /
minute Plant B
21
27
40
50
34
20
10
16
25
30
10
1. What is the dependent variable and how do you know?
2. What is the independent variable and how do you know?
3. What title would you give the graph?
4. What type of graph should you make? (Line, Bar, or Circle)
5. After making your graph, at what depths should Mr. K place
Plant A and Plant B?

Answers: 2


Other questions on the subject: Biology
Biology, 22.06.2019 03:30, sCoTtYbOy5329
What organelle other than the nucleus houses dna in a eukaryotic cell?
Answers: 1
Biology, 22.06.2019 10:40, sierralynnbaldp16d4b
Which of the following was not a major animal on land during the carboniferous period? amphibians insects both a and b none of the above
Answers: 1
Do you know the correct answer?
MIT. is trying to pick aquatic plants to put in his lake. These
plants add oxygen to the water, wh...
Questions in other subjects:

Chemistry, 30.04.2021 07:20

Mathematics, 30.04.2021 07:20

Mathematics, 30.04.2021 07:20
Mathematics, 30.04.2021 07:20

Spanish, 30.04.2021 07:20


History, 30.04.2021 07:20


