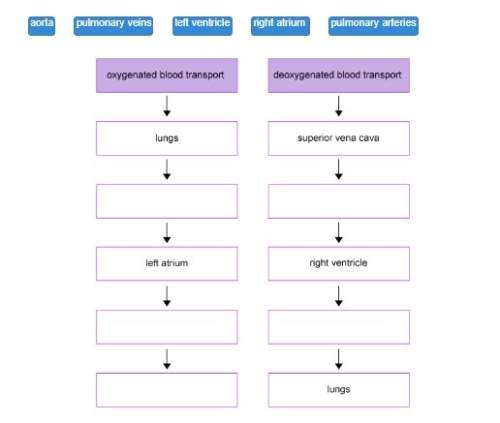
Biology
Biology, 10.06.2021 17:10, tinalmath

The graph shows the size of two populations of the same species over time. 35
30
25
20
Number of individuals
15
Area A
10
Are B
5
1.2) 45.628101112131415
Time
Which of these limiting factors is likely to be more plentiful in area A than in
area B?
A. Flooding
B. Disease
C. Shelter
D. Predators


The graph shows the size of two populations of the same species over time.

35
30
25
20
Number of

answer
Answers: 3

Other questions on the subject: Biology

image
Biology, 21.06.2019 16:00, farhadi2
The health, management and conservation of biodiversity, is a challenge facing ecosystems worldwide. the major factors that affect the health and function of the great barrier reef are climate change and pollution. which question investigates the effects of a biotic factor on the reef ecosystem?
Answers: 2
image
Biology, 22.06.2019 07:30, ayanajames0928
What will happen if deforestation continue to destroy the green plant on the planet
Answers: 2
image
Biology, 22.06.2019 13:00, Brooke7644
In trying to determine whether dna or protein is the genetic material, hershey and chase made use of which of the following facts? a) dna contains sulfur, whereas protein does not. b) dna contains phosphorus, whereas protein does not. c) dna contains nitrogen, whereas protein does not. d) dna contains purines, whereas protein includes pyrimidines.
Answers: 3
image
Biology, 22.06.2019 15:40, milkshakegrande101
Read the article and use the information to answer the questions that follow discovering the structure of dna explain how the discoveries by rosalind franklin watson and crick build an accurate model of dna done
Answers: 2
Do you know the correct answer?
The graph shows the size of two populations of the same species over time. 35
30
25

Questions in other subjects:

Konu
Mathematics, 30.12.2019 02:31
Konu
Mathematics, 30.12.2019 02:31