

Biology, 19.05.2021 17:30, jeffffffff
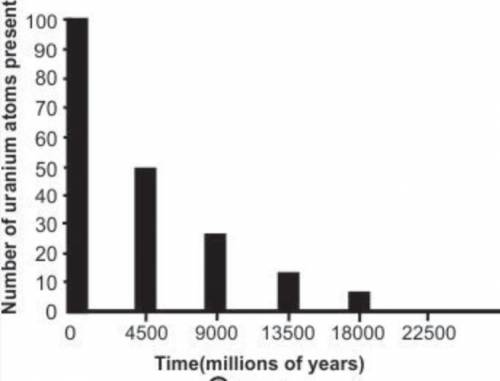
The graph below shows the radioactive decay of an isotope of uranium.
Bar graph showing time in millions of years on x axis and number of uranium atoms present on y axis. Height of bar corresponding to time 0 million years is 100; time 4500 million years is 50; time 9000 million years is 25; time 13,500 million years is 12.5; and time 18,000 million years is 6.25.
Based on the graph, what is the half-life of uranium?
50 years
100 years
4,500 years
9,000 years

Answers: 2


Other questions on the subject: Biology
Biology, 22.06.2019 12:30, Hunter1471
Creating new things to solve problems and improve life depends on the close interaction of which two fields?
Answers: 2
Biology, 22.06.2019 19:00, daniellekennedy05
Which is the most dominant generation in a liverwort
Answers: 1
Do you know the correct answer?
The graph below shows the radioactive decay of an isotope of uranium.
Bar graph showing time in mil...
Questions in other subjects:


Chemistry, 18.07.2019 15:00

Social Studies, 18.07.2019 15:00

Mathematics, 18.07.2019 15:00
Biology, 18.07.2019 15:00
History, 18.07.2019 15:00
Biology, 18.07.2019 15:00


