

Biology, 06.05.2021 22:40, alyxkellar06
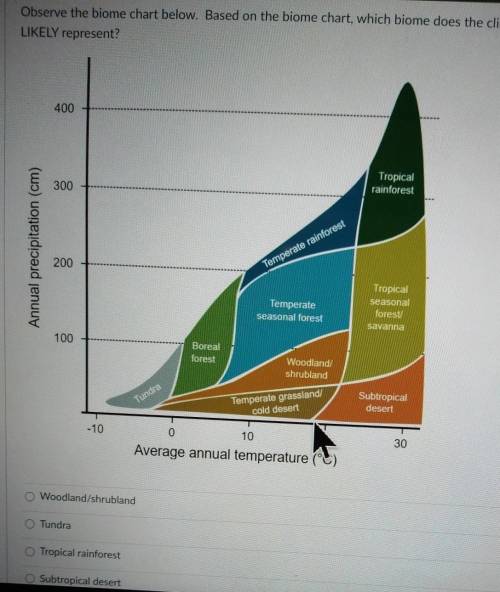
Observe the biome chart below. Based on the biome chart, which biome does the climatograph above MOST LIKELY represent? 400 Tropical rainforest 300 Annual precipitation (cm) 200 Temperate rainforest Temperate seasonal forest Tropical seasonal forest savanna 100 Boreal forest Woodland/ shrubland Subtropical desert Tundra Temperate grasslar cold desert -10 30 0 10 20 Average annual temperature (°C) O Woodland/shrubland O Tundra O tropical rainforest O subtropical desert

Answers: 3


Other questions on the subject: Biology
Biology, 21.06.2019 13:30, trodgers0202
The afrikaners are an example of a founder effect that occurs when a new colony is started by a few members of the original population and the random decrease in genetic variation is an example of
Answers: 1
Biology, 22.06.2019 21:00, Kimmie2019
Disaccharides include what sugar molecules. true or false?
Answers: 1
Do you know the correct answer?
Observe the biome chart below. Based on the biome chart, which biome does the climatograph above MOS...
Questions in other subjects:

Geography, 07.10.2021 14:00


Physics, 07.10.2021 14:00
Mathematics, 07.10.2021 14:00
Biology, 07.10.2021 14:00
Mathematics, 07.10.2021 14:00


