

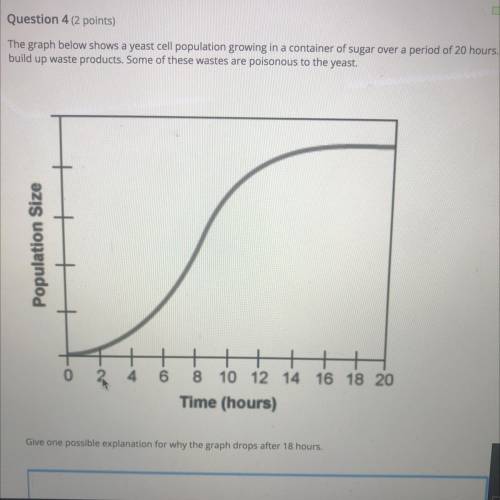
The graph below shows a yeast cell population growing in a container of sugar over a period of 20 hours. Yeast will consume the sugar and
build up waste products. Some of these wastes are poisonous to the yeast.
Give one possible explanation for why the graph drops after 18 hours.

Answers: 2


Other questions on the subject: Biology
Biology, 22.06.2019 00:30, nayellisoto15
Compare and contrast cladistics and phylogeny. what are their advantages and disadvantages? which is the most useful in understanding how an organism developed into its current form? which concept most strongly supports your opinion about the origin of any given organism?
Answers: 1
Biology, 22.06.2019 12:30, tiarafaimealelei
This is collection of data made by comparing objects in standard units. in science, the units are metric.
Answers: 3
Biology, 22.06.2019 13:00, dianelys3083p5spb5
Which of the following cell structures is significantly different between gram- positive and gram-negative bacteria?
Answers: 3
Do you know the correct answer?
The graph below shows a yeast cell population growing in a container of sugar over a period of 20 ho...
Questions in other subjects:


