

Biology, 06.05.2021 21:30, Poohpooh1510
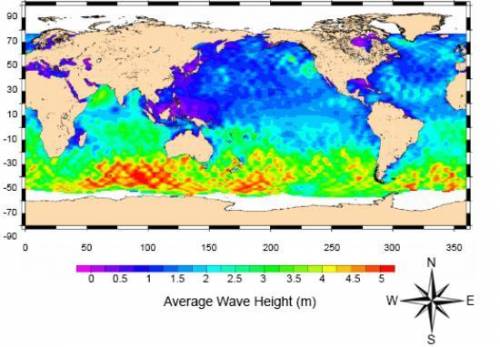
The following map shows the average height of ocean waves over a ten-day period. The purple and blue regions that cover most of the Northern Hemisphere experienced very small waves, while the yellow, orange, and red regions that cover a large part of the Southern Hemisphere received much larger waves.
Based on the data in the map, which of the following statements is most likely true about the ten-day period when these measurements were made?
A. Tides were stronger in the Southern Hemisphere than in the Northern Hemisphere.
B. The water in the Southern Hemisphere was less dense than the water in the Northern Hemisphere.
C. There were stronger winds in the Southern Hemisphere than in the Northern Hemisphere.
D. The water in the Southern Hemisphere was warmer than the water in the Northern Hemisphere.

Answers: 2


Other questions on the subject: Biology
Biology, 22.06.2019 05:50, katiekern5207
How is the carbon cycle related to global warming ?
Answers: 2
Biology, 22.06.2019 09:30, jimennacastillo15
Archaebacteria use for movement. celia flagella pili cell walls
Answers: 2
Do you know the correct answer?
The following map shows the average height of ocean waves over a ten-day period. The purple and blue...
Questions in other subjects:

Physics, 25.02.2021 22:10

Mathematics, 25.02.2021 22:10

Social Studies, 25.02.2021 22:10
Mathematics, 25.02.2021 22:10


History, 25.02.2021 22:10
Mathematics, 25.02.2021 22:10
Mathematics, 25.02.2021 22:10


