

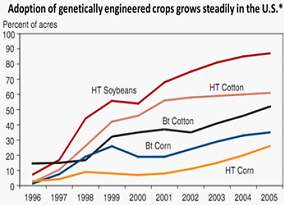
The graph below shows the percentage of acres in the united states that is dedicated to genetically engineered crops.
what can be concluded from the graph?
a. the number of genetically engineered crops that are grown in the united states grew from 1996 to 2005.
b. the number of genetically engineered crops that are grown in the united states declined from 1996 to 2005
c. the percentage of acres that is dedicated to genetically engineered crops grew from 1996 to 2005.
d. the percentage of acres that is dedicated to genetically engineered crops fell from 1996 to 2005.

Answers: 2


Other questions on the subject: Biology
Biology, 21.06.2019 19:40, TimaGarcia
What feature of cell theory is best demonstrated in the image
Answers: 1
Do you know the correct answer?
The graph below shows the percentage of acres in the united states that is dedicated to genetically...
Questions in other subjects:

Mathematics, 23.02.2020 05:12

Mathematics, 23.02.2020 05:13
Mathematics, 23.02.2020 05:13
Mathematics, 23.02.2020 05:15
Mathematics, 23.02.2020 05:23
Mathematics, 23.02.2020 05:28


