


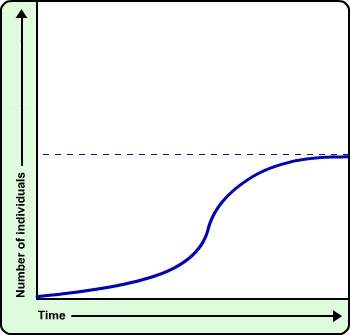
Which is true of the population shown in this graph?
a.
it shows the effect of overpop...

Biology, 18.08.2019 18:30, angeline2004
Which is true of the population shown in this graph?
a.
it shows the effect of overpopulation on a species.
b.
the number of individuals will eventually drop to zero.
c.
the population has increased until it reached its carrying capacity.
d.
there are no limiting factors to control population growth.

Answers: 1
Other questions on the subject: Biology
Biology, 21.06.2019 17:40, mimithurmond03
In the family tree below, people with the recessive trait of attached earlobes are shaded gray.
Answers: 1
Biology, 21.06.2019 22:00, lizzyhearts
What types of energy transfers and energy transportations are involved in the domino chain reaction?
Answers: 1
Biology, 22.06.2019 10:30, DakotaOliver
Grasses--> mice--> cats--> coyotes suppose 10,000 units of energy are available at the level of the grasses. what is the total number of energy units lost by the time energy reaches the coyote?
Answers: 2
Biology, 22.06.2019 10:30, pinklover2002
Which of the following statements is accurate about evolution? question 10 options: natural selection only eliminates odd individuals. evolution means that a population never has changes in its genetic frequencies. mutations are always harmful. evolution means that a population undergoes changes in its gene frequencies over time.
Answers: 1
Do you know the correct answer?
Questions in other subjects:


History, 23.06.2019 23:40
Mathematics, 23.06.2019 23:40


Spanish, 23.06.2019 23:40
History, 23.06.2019 23:40
Biology, 23.06.2019 23:40


