

Biology, 19.04.2021 21:10, mokunola16
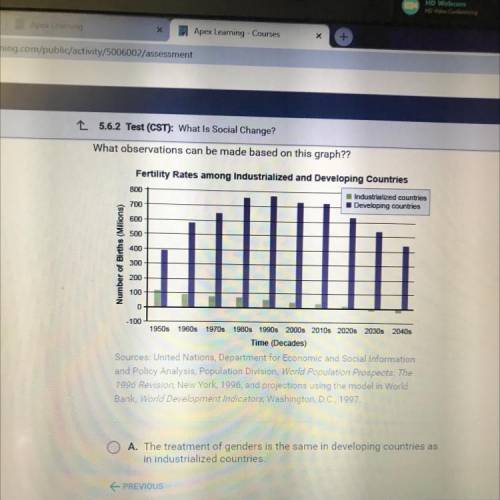
What observations can be made based on this graph??
Fertility Rates among Industrialized and Developing countries
800
Industrialized countries
Developing countries
700
600
500
400
Number of Births (Millions)
300
200
100
0
-100
1950s 1960s 1970s 1980s 1990s 2000s 2010s 2020s 2030s 2040s
Time (Decades)

Answers: 2


Other questions on the subject: Biology
Biology, 22.06.2019 03:30, Elexis8591
In pea plants, the allele for inflated pod seed, i, is dominant over the allele for constricted pod seed, i. the punnett square shows a cross for this trait. which offspring will be homozygous dominant
Answers: 2
Biology, 22.06.2019 11:00, BigDaddy1220
Answers to mastering biology drag the labels to their appropriate locations to complete the punnett squares for morgan's reciprocal cross. drag blue labels onto the blue targets to indicate the genotypes of the parents and offspring. drag pink labels onto the pink targets to indicate the genetic makeup of the gametes (sperm and egg). labels can be used once, more than once, or not at all. hints
Answers: 3
Do you know the correct answer?
What observations can be made based on this graph??
Fertility Rates among Industrialized and Develo...
Questions in other subjects:

Mathematics, 29.01.2020 06:49

Social Studies, 29.01.2020 06:49
Mathematics, 29.01.2020 06:49


Chemistry, 29.01.2020 06:49
Mathematics, 29.01.2020 06:49
Mathematics, 29.01.2020 06:49
English, 29.01.2020 06:49


