

Biology, 09.04.2021 05:30, kyrabrown33
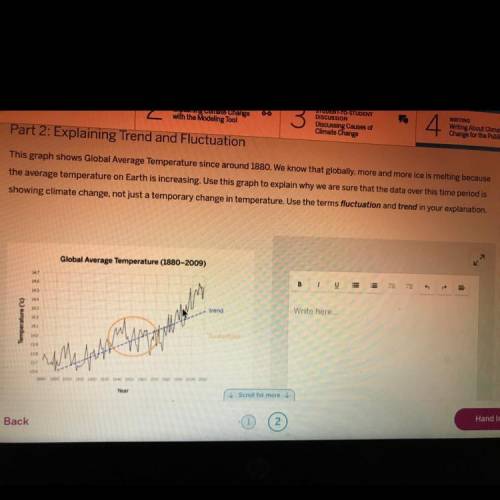
This graph shows Global Average Temperature since around 1880. We know that globally, more and more ice is melting because
the average temperature on Earth is increasing. Use this graph to explain why we are sure that the data over this time period is
showing climate change, not just a temporary change in temperature. Use the terms fluctuation and trend in your explanation.
Global Average Temperature (1880-2009)

Answers: 2


Other questions on the subject: Biology
Biology, 21.06.2019 17:50, noobgirlaskthequest
How did the research presented in the article affect scientists' understanding of the evolution of eukaryotes
Answers: 3
Biology, 21.06.2019 23:40, datboyjulio21
1. which of the following is correct regarding opiates/opioids: a. they all have a natural component as a starting pointb. they have low addiction possibilitiesc. methadone binds to some of the same receptorsd. a and care correcte. all are correct
Answers: 1
Biology, 22.06.2019 07:50, kailahgranger
In each transformation of energy , some energy what?
Answers: 1
Do you know the correct answer?
This graph shows Global Average Temperature since around 1880. We know that globally, more and more...
Questions in other subjects:


Biology, 15.05.2021 06:20

Mathematics, 15.05.2021 06:20
Mathematics, 15.05.2021 06:20
Mathematics, 15.05.2021 06:20


