

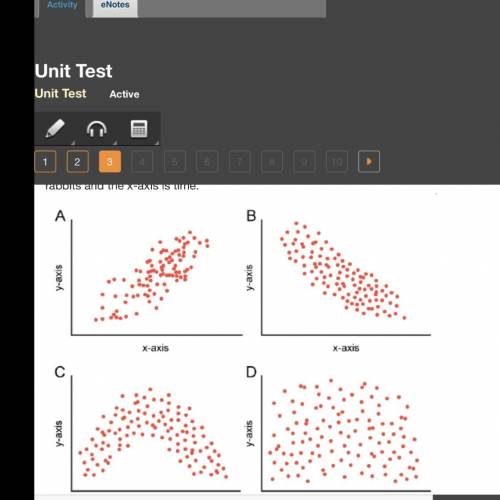
The scatterplots indicate the population of rabbits in the population over time. The y-axis represents the number of rabbits and the x-axis is time.
Which graph most likely represents a rabbit population that found a new, larger habitat, but then eventually experienced an increase in predation?
Graph A
Graph B
Graph C
Graph D

Answers: 1


Other questions on the subject: Biology
Biology, 21.06.2019 18:10, addiemaygulley2835
In general, how long does it take to accomplish a long-term goal? a. a few days to a weekb. a few weeks to a monthc. a few months to a yeard. more than a year
Answers: 2
Biology, 21.06.2019 21:00, natasniebow
Epinephrine is a hormone released from the adrenal gland of the body, most often in a stressful situation. it is known as the "fight-or-flight" hormone. one way that it causes a response in the body is to activate receptors on muscle cells. where are these cellular receptors located? a. on the cell membrane b. in the nucleus c. on the cell wall d. around the mitochondria
Answers: 1
Biology, 22.06.2019 10:00, jamesmith20
In one or two well-crafted paragraphs in your laboratory journal, summarize the process in which normal cells become cancer cells. your paragraph(s) must include each of the terms listed below. underline each term in your writing:
Answers: 2
Do you know the correct answer?
The scatterplots indicate the population of rabbits in the population over time. The y-axis represen...
Questions in other subjects:


Mathematics, 30.06.2020 02:01
Mathematics, 30.06.2020 02:01
Mathematics, 30.06.2020 02:01

Biology, 30.06.2020 02:01
Mathematics, 30.06.2020 02:01


