

Biology, 27.03.2021 17:00, shyanne9364
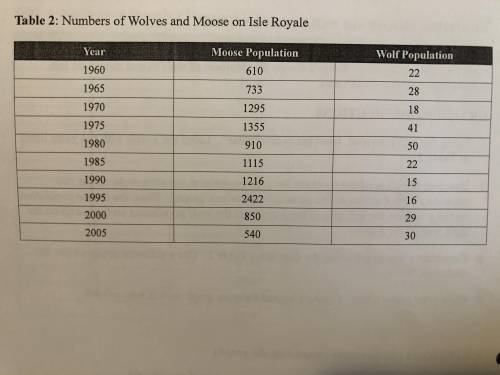
1. Using the grid provided, label the x-axis “Year". Label the x-axis with the years listed in picture one below.
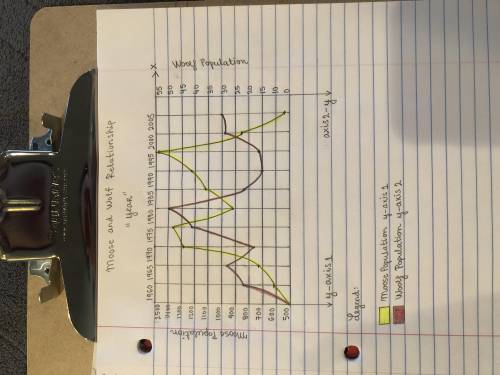
2. Based on the sizes of the numbers for each population, create a scale on the two separate y-axes (similar to the snowshoe hare-lynx graph). Place the moose population on the y-axis on the left side of the x-axis and the wolf population on the y-axis on the right side of the x-axis.
3. Construct a line graph using the data from Table 2. Use a different coloured line for each population.
4.Give your graph a title. Create a legend for your graph so it is easy to read.
after your done with graph please answer this questions!
1. Describe the relationship between the moose and wolf populations.
2. What biotic and abiotic factors might influence the moose and wolf populations?
3.How would the carrying capacity for wolves be influenced if a large number of moose were killed by humans?
also please make sure the grid your using is the same as in picture two below!


Answers: 2


Other questions on the subject: Biology
Biology, 21.06.2019 17:00, justinhudson17
Energy derived from hot rocks and fluids beneath the earth’s surface is
Answers: 1
Biology, 22.06.2019 02:00, jaquiel9358
Name the glands associated with human digestive system
Answers: 1
Do you know the correct answer?
1. Using the grid provided, label the x-axis “Year". Label the x-axis with the years listed in pictu...
Questions in other subjects:
Biology, 04.03.2021 23:30


English, 04.03.2021 23:30


Mathematics, 04.03.2021 23:30


