Global Carbon Emissions from Fossil Fuels, 1900-2011
Average global temperature by year
10,00...

Biology, 03.03.2021 09:50, QwesiElorm
Global Carbon Emissions from Fossil Fuels, 1900-2011
Average global temperature by year
10,000
9,000
4,000
Milo Metre Tons Carton
7.000
6,000
5,000
4,000
3.000
umans humorum ,
2,000
1,000
0
1900 1910 1920 1930 190 1950 1950 1970 1980 190 2000 2010
55
12
1950
1975
2000
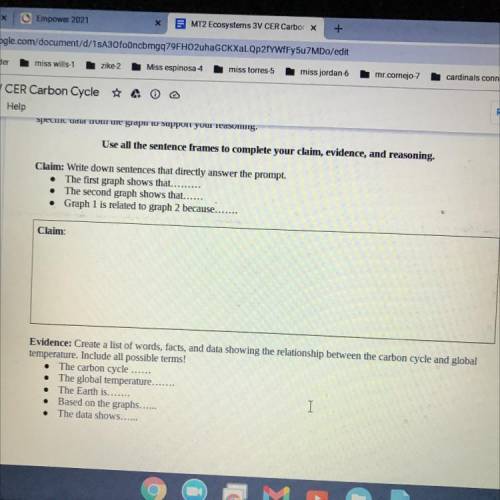
Prompt: Analyze the data in the graphs above, and explain the relationship between the carbon cycle and global
temperature. Include an example on how human activities have impacted the balance of the carbon cycle. Cite
specific data from the graph to support your reasoning.


Answers: 2
Other questions on the subject: Biology


Biology, 22.06.2019 05:30, natashawetzel5961
Aheterozygous normal male marries a woman with a sickle cell anemia. give the genotypes and possible phenotypes of the offspring
Answers: 2


Biology, 22.06.2019 10:30, haileyw123
Ras is a g-protein that is activated when a growth factor attaches to egfr. its activation results in the replacement of a gdp molecule with a gtp molecule, thus allowing a signal transduction pathway to be activated. considering the signal pathway illustrated on this page, what is one potential outcome of a mutation in the ras gene that leads to ras protein hyperactivity. be specific.
Answers: 3
Do you know the correct answer?
Questions in other subjects:

Social Studies, 10.12.2021 18:50


Biology, 10.12.2021 18:50

Mathematics, 10.12.2021 18:50


Geography, 10.12.2021 18:50


Mathematics, 10.12.2021 18:50


