

Biology, 28.02.2021 21:20, djfluffyman999
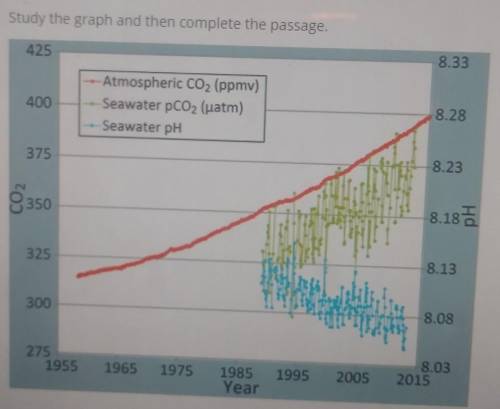
Study the graph and then complete the passage. 425 8.33 400 Atmospheric CO2 (ppmv) Seawater pCO2 (uatm) Seawater pH 8.28 375 8.23 CO2 350 8.185 PETITE 325 8.13 300 8.08 275 1955 1965 1975 1995 2005 8.03 2015 1985 Year The graph shows data collected near the Mauna Loa volcano in Hawaii from 1955 to 2015. The data includes atmospheric CO2 levels, seawater CO2 concentrations, and seawater pH readings. If the current trend continues, the seawater near Mauna Loa will likely become more alkaline due to the changing concentration of in the water.

Answers: 2


Other questions on the subject: Biology
Biology, 21.06.2019 21:00, dkargbo6034
If water is at -10 ° c and energy is added to the water until it is 50 ° c while maintaining a constant pressure of 760 mmhg, describe the phase change of the water?
Answers: 2
Biology, 22.06.2019 09:20, vince022503
Match the following items 1. rr 2. rr 3. identical alleles 4. unlike alleles 5. rr ()homozygous, recessive ()homozygous definition ()heterozygous, dominant cell ()heterozygous definition () homozygous, dominant cell
Answers: 2
Do you know the correct answer?
Study the graph and then complete the passage. 425 8.33 400 Atmospheric CO2 (ppmv) Seawater pCO2 (ua...
Questions in other subjects:

Mathematics, 15.07.2020 04:01


History, 15.07.2020 04:01


