

Biology, 12.02.2021 22:00, duhitzmay4693
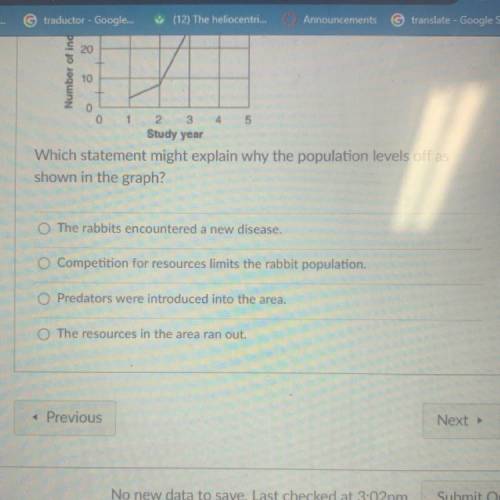
The graph below shows the population of a group of rabbits in a
restricted area studied over a period of 5 years.
Which statement might explain why the population levels off as
shown in the graph?

Answers: 2


Other questions on the subject: Biology
Biology, 21.06.2019 18:10, screamolover1700
What is unique about the members of the group of fungi to which penicillium notatum belongs? they are not important for medicine. they are not made up of hyphae. they are used in fermentation. they lost the reproductive phase.
Answers: 2
Biology, 22.06.2019 00:30, kcnawlay170
Name the types of burns one can get and which structures of the integument are damaged
Answers: 1
Biology, 22.06.2019 01:30, emmilicious
The reactions that occur in the ribosome, where amino acids are combined to form proteins are anabolic or catabolic?
Answers: 1
Biology, 22.06.2019 04:30, dondre54
African penguins, which inhabit the coasts of southern africa, were classified as an endangered species in 2010. two significant threats to their survival are ecosystem damage from oil spills and overfishing by humans. overfishing depletes the food supply of african penguins. the best method to reduce the threat of overfishing would be to . the risk of oil spills could be reduced by increasing the use of , which should oil consumption. if an oil spill does occur, could be used to remove the oil so the ecosystem may more quickly recover.
Answers: 2
Do you know the correct answer?
The graph below shows the population of a group of rabbits in a
restricted area studied over a peri...
Questions in other subjects:


Mathematics, 29.07.2019 19:30
Biology, 29.07.2019 19:30
Mathematics, 29.07.2019 19:30
History, 29.07.2019 19:30
History, 29.07.2019 19:30


English, 29.07.2019 19:30


