

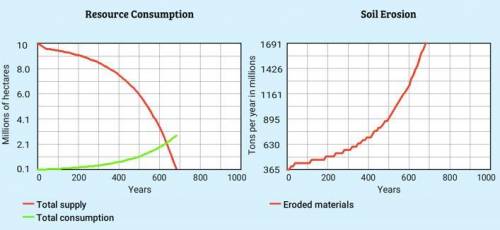
The graph on the left shows the supply and consumption of forests when the consumption rate and population growth rate are both low. The graph on the right shows soil erosion under the same conditions.
Which conclusion do the graphs support?
a
As consumption of lumber decreases, forest resources and soil erosion also decrease.
b
When forests are cut down faster than they can be replenished, soil erosion quickly increases.
c
As consumption of lumber increases, forest resources and soil erosion also increase.
d
When forests are cut down faster, they are replenished faster, and soil erosion is kept in check.

Answers: 2


Other questions on the subject: Biology
Biology, 21.06.2019 22:00, lizzyhearts
What types of energy transfers and energy transportations are involved in the domino chain reaction?
Answers: 1
Biology, 22.06.2019 11:30, kmchippps
According to theories of how life began, how did early organic molecules begin to separate from the outside world? a: specialized enzymes were required b: chains of amino acids created a barrier c: formation of microspheres or vesicles d: rna catalyzed the formation of membranes
Answers: 3
Do you know the correct answer?
The graph on the left shows the supply and consumption of forests when the consumption rate and popu...
Questions in other subjects:


Mathematics, 05.09.2020 20:01

Mathematics, 05.09.2020 20:01

Mathematics, 05.09.2020 20:01
Mathematics, 05.09.2020 20:01


