

Biology, 27.01.2021 02:50, lizethyyaritza16
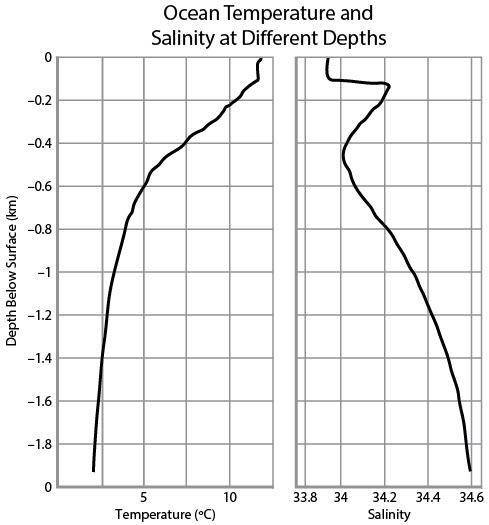
The graphs below show the change in temperature and salinity of a region of ocean as an instrument is lowered below the surface. Depth is measured in kilometers below the surface, temperature in degrees Celsius, and salinity in parts per thousand.
Image of two graphs. The left graph has the x-axis labeled temperature (degree C) ranging from 0 to 10. The y-axis is labeled depth below surface (km) ranging from -1.8 to 0. The line on graph goes up vertically starting at about 2 °C on the x-axis and -1.9 km on the y-axis. The vertical line goes up staying at about 2 degree C and climbs from -1.9 km to about -0.8 km. The line starts to shift right at -0.6 km. The line shifts to the right from 2 degree C to 5 degree C. The line shifts to right more starting at -0.5 km and reaches 10 °C around -0.2 km. The line continues up vertically after -0.2 km. The right graph has the x-axis labeled salinity ranging from 33.8 to 34.6. The y-axis is labeled depth below surface (km) ranging from -1.8 to 0. The line on the graph starts at 34 on the x-axis and 0 km on the y-axis. The line starts to shift to the right at -0.1 km and levels out at 34.2 on the x-axis. At -0.2 km the line shifts to the left and continues to shift left until it reaches -0.5 km. The line starts to shift to the right again at -0.6 and continues to shift right until it reaches -1.9 km on the y-axis and 34.6 on the x-axis.
© 2015 protonsforbreakfast. wordpress
What is the most valid conclusion regarding ocean salinity based on the data?
Ocean salinity is not related to water temperature.
Ocean salinity changes with depth at a steady rate throughout the entire water column.
Ocean salinity increases as ocean temperature decreases.
Ocean salinity is more stable at higher temperatures than at lower temperatures.

Answers: 1


Other questions on the subject: Biology
Biology, 22.06.2019 10:00, abbypark0804
Which step is not included in the step approach to calculating the greatest common divisor?
Answers: 3
Biology, 22.06.2019 10:20, saucyyyyniahhhhh
Aquaternary consumer species would be expected to have a smaller population than a secondary consumer species. select the best answer from the choices provided t f
Answers: 1
Do you know the correct answer?
The graphs below show the change in temperature and salinity of a region of ocean as an instrument i...
Questions in other subjects:


Spanish, 07.05.2021 21:00
Mathematics, 07.05.2021 21:00

History, 07.05.2021 21:00
Mathematics, 07.05.2021 21:00
Mathematics, 07.05.2021 21:00


