

Biology, 24.01.2021 21:20, MalikaJones
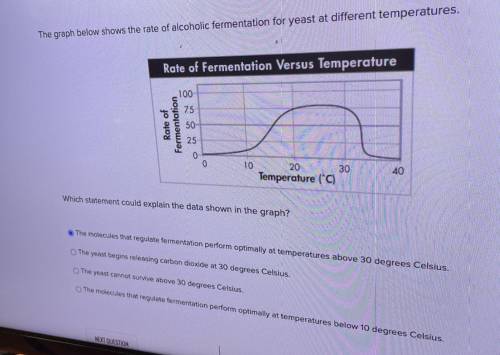
The graph below shows the rate of alcoholic fermentation for yeast at different temperatures.
Rate of Fermentation Versus Temperature
100
Rate of
Fermentation
50
0
10
20 30
Temperature (°C)
40
Which statement could explain the data shown in the graph?
The molecules that regulate fermentation perform optimally at temperatures above 30 degrees Celsius.
The yeast begins releasing carbon dioxide at 30 degrees Celsius.
The yeast cannot survive above 30 degrees Celsius.
The mecdes that regulate fermentation perform optimally at temperatures below 10 degrees Celsius.
JESTOS

Answers: 2


Other questions on the subject: Biology
Biology, 21.06.2019 14:00, leahumelinda
She planned to observe the flowers for the next five days for an hour at the same time each afternoon. then she wou the data in a multiple line graph to compare the number of bees that visited each flower. which statement best descr data in this investigation?
Answers: 3
Biology, 22.06.2019 01:00, lizzyhearts
Mr. olajuwan was in a horrific snowmobile accident. afterwards he had trouble walking and he had a loss of balance. which of the 4 major brain region was probably demaged
Answers: 1
Do you know the correct answer?
The graph below shows the rate of alcoholic fermentation for yeast at different temperatures.
Rate...
Questions in other subjects:


Biology, 26.02.2021 01:20
Mathematics, 26.02.2021 01:30

Mathematics, 26.02.2021 01:30


