


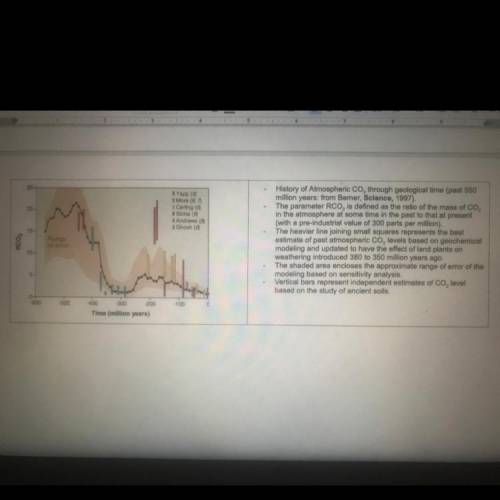
Atmospheric Carbon Timeline
Analyze the Atmospheric Carbon Timeline graph attached
Describe y...

Biology, 17.01.2021 14:00, cailynrachael
Atmospheric Carbon Timeline
Analyze the Atmospheric Carbon Timeline graph attached
Describe your observations using between 150-250 words.
DO NOT REGURGITATE the graph description, but use it as a source of information to INFER WHY carbon dioxide levels changed over the last
550 milion years
Use the following as a starting point, you may make several CLAIM, EVIDENCE, REASONING statements
First - Make a CLAIM
Then - What is your EVIDENCE?
Pinalty - What is your REASONING?
What processes could have contributed to move carbon in and out of the atmosphere?
Use 150-250 words

Answers: 2
Other questions on the subject: Biology
Biology, 21.06.2019 16:00, farhadi2
The health, management and conservation of biodiversity, is a challenge facing ecosystems worldwide. the major factors that affect the health and function of the great barrier reef are climate change and pollution. which question investigates the effects of a biotic factor on the reef ecosystem?
Answers: 2
Biology, 22.06.2019 08:00, lmorace
Aparent with freckles is crossed with a parent without freckles. the punnett square shows the possible genotypes and phenotypes of the offspring. which statement accurately describes the probability of phenotypes? a. the offspring are more likely to have freckles. b. the offspring are more likely to have no freckles. c. the likelihood of the offspring having freckles and not having freckles is the same. d. the likelihood of the offspring having freckles and not having freckles cannot be determined.
Answers: 1
Biology, 22.06.2019 11:20, sipstick971
Scientific evidence is most likely to be consistent if it is based on data from
Answers: 2
Biology, 22.06.2019 17:20, kcarstensen59070
If you were given a map of the sensory cortex in the postcentral gyrus of the cerebrum, do you think the map would have more “space” devoted to the regions of the body that have the highest density of sensory receptors, or the regions of the body that have the lowest density of sensory receptors? explain.
Answers: 2
Do you know the correct answer?
Questions in other subjects:


Chemistry, 24.02.2020 22:46
Mathematics, 24.02.2020 22:46


