


1 point
6.
What does this graph of plant heights show?
60 f Height (cm)
55
...

Biology, 14.01.2021 21:50, icantdomath4910
1 point
6.
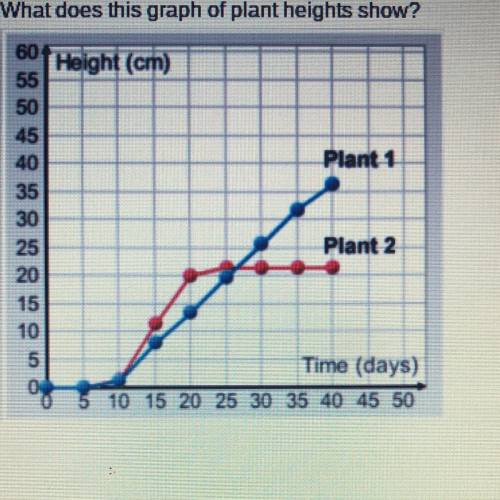
What does this graph of plant heights show?
60 f Height (cm)
55
50
Plant 1
45
40
35
30
25
20
15
10
5
Plant 2
Time (days)
5 10 15 20 25 30 35 40 45 50
O Plant 2 ended up taller than Plant 1.
O Plant 1 was always taller than Plant 2.
O Plant 1 grew steadily. Plant 2 grew quickly at first and then stopped
growing
O Plant 2 grew steadily. Plant 1 grew slowly at first and then grew quickly.

Answers: 3
Other questions on the subject: Biology
Biology, 22.06.2019 07:50, darceline1574
Which of the following types of stars is most likely to end up as a supernova? in graph a, the curve peaks at 800 nm, in the red section of the visible light spectrum. in graph b, the curve peaks at 550 nm, in the green section of the visible light spectrum. in graph c, the curve peaks at 450 nm, in the blue section of the visible light spectrum. in graph d, the curve peaks at 300 nm, in the violet section of the visible light spectrum. a b c d
Answers: 2
Biology, 22.06.2019 14:30, raedusty3200
How can we use spectral lines of light coming from the superclusters to identify which is receding from earth at the slowest rate.
Answers: 2
Biology, 22.06.2019 16:30, moneykey
Urgent in guinea pigs, black fur (b) is dominant over white fur (b). cross a heterozygous (hybrid) black guinea pig with a homozygous (purebred) white guinea pig. complete a punnett square, identify the genotype(s), phenotype(s), and probability (% and fraction) that the offspring will be black and white?
Answers: 1
Do you know the correct answer?
Questions in other subjects:

Chemistry, 09.07.2019 10:20


History, 09.07.2019 10:20
Mathematics, 09.07.2019 10:20
Geography, 09.07.2019 10:20
Biology, 09.07.2019 10:20


