

Biology, 12.01.2021 03:10, KrishnaBalaram1235
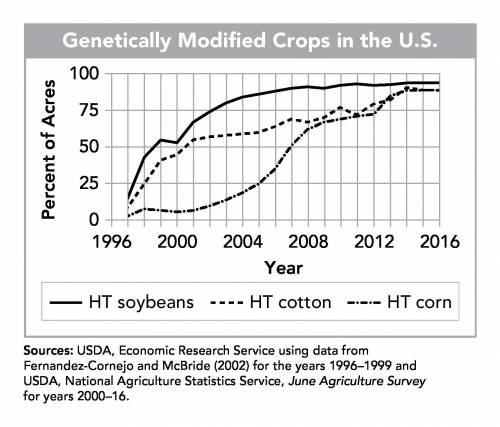
The line graph shows the changing use of three herbicide-tolerant (HT) genetically modified farm crops in the United States from 1997 to 2016.
Based on the evidence shown in the graph, which of these changes is MOST LIKELY to have occurred on farms in the United States during the same time period?
A. decreased use of herbicides on soybean fields
B. decreased nutritional value of the average ear of corn
C. decreased value of the total soybean crop
D. decreased concentrations of weeds on cotton fields

Answers: 1


Other questions on the subject: Biology
Biology, 22.06.2019 01:30, timothyashburn8
Twin boys have girlfriends one of the couples have a baby would the dna of the lil baby be the same as the couples dna bc the boys are identical twins
Answers: 1
Biology, 22.06.2019 09:30, dooboose15
Along what geographical feature are most of the oil producing regions located
Answers: 1
Biology, 23.06.2019 01:00, brinicole1011
Could anybody give me the answer to this question.
Answers: 3
Do you know the correct answer?
The line graph shows the changing use of three herbicide-tolerant (HT) genetically modified farm cro...
Questions in other subjects:


Biology, 07.06.2021 07:40
History, 07.06.2021 07:40


Mathematics, 07.06.2021 07:40
Mathematics, 07.06.2021 07:40


