


The graph shows three different projections of human population growth.
16,000
14,000
U...

Biology, 07.01.2021 07:00, DondreeColeman
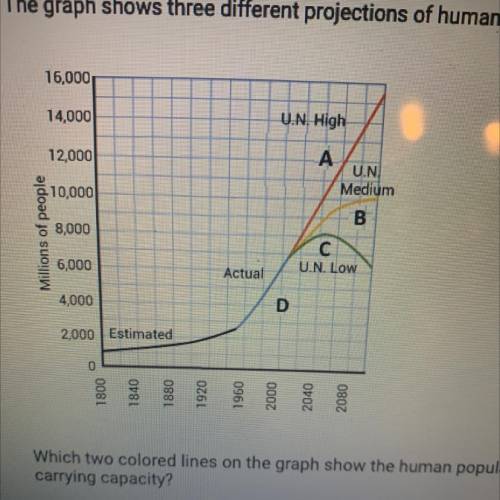
The graph shows three different projections of human population growth.
16,000
14,000
U. N. High
12,000
A
UN
Medium
10,000
B
Millions of people
68,000
C
U. N. LOW
6,000
Actual
4,000
D
2,000 Estimated
0
1800
1840
1880
1920
0961
2000
2040
OROZ
Which two colored lines on the graph show the human population reaching
carrying capacity?
A. Line B and line D
B. Line A and line B
O C. Line B and line C

Answers: 2
Other questions on the subject: Biology
Biology, 21.06.2019 18:30, brevenb375
How is the male reproductive system different from other body systems? it isn’t necessary to vital signs. it monitors other body systems, and adjusts if necessary. it transports items from one system to another. it is the only system that produces hormones in the male.
Answers: 1
Biology, 22.06.2019 00:10, anayamulay
The kind of fertilization found in the majority of aquatic animals is (internal or external) fertilization.
Answers: 1
Do you know the correct answer?
Questions in other subjects:


Business, 06.07.2019 21:30

Spanish, 06.07.2019 21:30
Biology, 06.07.2019 21:30
Spanish, 06.07.2019 21:30


