

Biology, 11.12.2020 01:40, augestfaith
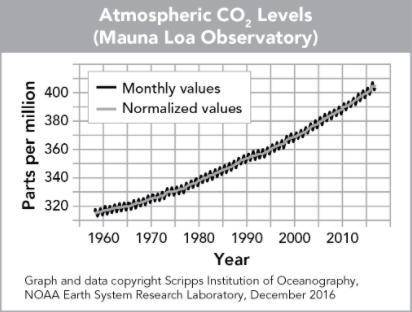
The graph shows the atmospheric levels of carbon dioxide.
The Y-axis is atmospheric carbon dioxide levels in parts per million and runs from 310 to 410. The x-axis is marked in 10-year increments from 1960 to 2010. A zigzag line shows the monthly values. A high point is about 80 parts per million greater than the adjacent low points. There are 10 high points and 10 low points per 10 –year period. A straight line through the center of the zigzag line shows normalized values. In 1958, the level of atmospheric carbon dioxide was about 315 parts per million. In 2016, it was about 415 parts per million.
How have human activities contributed to the trend in the data shown in the graph?
A. Atmospheric carbon dioxide levels have remained steady because natural processes have balanced out human activities.
B. Atmospheric carbon dioxide levels have increased because the increasing human population exhales a greater volume of carbon dioxide.
C. Atmospheric carbon dioxide levels have increased because the burning of fossil fuels releases heat, which causes carbon dioxide to evaporate.
D. Atmospheric carbon dioxide levels have increased because the burning of fossil fuels releases carbon that otherwise would remain in the geosphere.

Answers: 1


Other questions on the subject: Biology
Biology, 21.06.2019 15:30, lilpeepxliltracy
*will mark brainliest to first correct answer* photosynthesis led to increasing levels during the later proterozoic eon? a. oxygen b. water c. carbon dioxide d. none of the above
Answers: 2
Biology, 22.06.2019 02:00, sanakhalid8881
The concept of keystone species is controversial among ecologists because most organisms are highly interdependent. if each of the trophic levels is dependant on all others how can we say one is most important
Answers: 3
Biology, 22.06.2019 07:00, kaperry
Amale bird-of-paradise uses a dance to attract mates in which it flaps its tail feathers on the ground and jumps around a potential female mate. a different male bird-of-paradise does a similar dance but it jumps around the female in the opposite direction. the female bird is only attracted to one style of dance, in one direction.
Answers: 3
Do you know the correct answer?
The graph shows the atmospheric levels of carbon dioxide.
The Y-axis is atmospheric carbon dioxide...
Questions in other subjects:


History, 15.12.2021 01:00

Business, 15.12.2021 01:00
Mathematics, 15.12.2021 01:00


