

Biology, 19.11.2020 19:20, kprincess16r
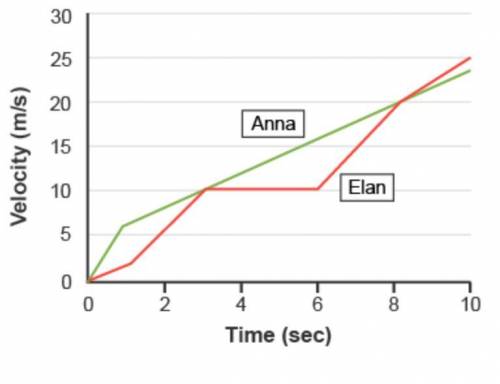
The graph depicts the velocity and times of Elan and Anna during a race.
Which best depicts the data?
A) From 0 to 2 seconds, Anna experienced negative acceleration.
B) From 3 to 6 seconds, Elan accelerated while Anna did not.
C) From 6 to 8 seconds, Elan accelerated faster than Anna.
D) From 8 to 10 seconds, Elan experienced negative acceleration.

Answers: 1


Other questions on the subject: Biology
Do you know the correct answer?
The graph depicts the velocity and times of Elan and Anna during a race.
Which best depicts the dat...
Questions in other subjects:


Mathematics, 01.02.2021 17:20

History, 01.02.2021 17:20

Mathematics, 01.02.2021 17:20
Mathematics, 01.02.2021 17:20


