

Biology, 29.10.2020 23:10, mikkelf6158
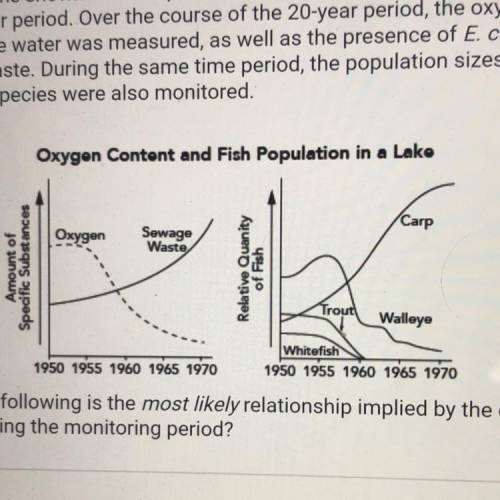
The two graphs shown below represent data collected from the same lake
over a 20-year period. Over the course of the 20-year period, the oxygen
content of the water was measured, as well as the presence of E. coli found
in sewage waste. During the same time period, the population sizes of
varying fish species were also monitored.
Oxygen Content and Fish Population in a Lake
Oxygen
Carp
Sewage
Waste
Amount of
Specific Substances
Relative
Quanity
of Fish
Trout
Walleye
1950 1955 1960 1965 1970
Whitefish
1950 1955 1960 1965 1970
Which of the following is the most likely relationship implied by the data
collected during the monitoring period?
A. The walleye population increases as sewage levels increase.
B. The whitefish population increases as oxygen levels decrease.
O C. The trout population decreases as oxygen levels decrease.
O D. The carp population decreases as sewage levels increase.

Answers: 3


Other questions on the subject: Biology
Biology, 22.06.2019 02:20, JAYDENJONES0111
What is the function of the somatic nervous system? connects the brain and the spinal cord to the rest of the body carry signals to the muscles and glands includes all nerves controlling the muscular system and external sensory receptors controls internal organs like the heart and bladder
Answers: 2
Biology, 22.06.2019 04:00, smooth5471
The transport tubes from food came down the plant are called?
Answers: 1
Biology, 22.06.2019 06:00, tramqpham25
In tomato plants, mendel found that the allele for smooth seeds (s) is dominant, while the allele for wrinkled seeds (s) is recessive. which of these punnett squares shows crosses between two plants heterozygous for smooth seeds? i need this to be answered as soon as ! sry the picture is bad quality
Answers: 3
Do you know the correct answer?
The two graphs shown below represent data collected from the same lake
over a 20-year period. Over...
Questions in other subjects:


Mathematics, 25.04.2020 01:51

Health, 25.04.2020 01:51
Biology, 25.04.2020 01:51

History, 25.04.2020 01:51


