


PLZ PLZ PLZ help me?!?!? Also the graph with the info is attached.
Question 1
Based on the gra...

Biology, 27.10.2020 14:00, JASMINEM6284
PLZ PLZ PLZ help me?!?!? Also the graph with the info is attached.
Question 1
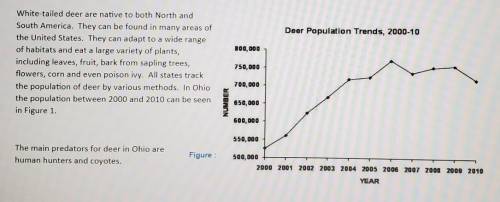
Based on the graph what might have happened to the number of deer predators between 2000 and 2004?
A The number of predators increased
B The number of predators decreased
C The number of predators equalized
D The number of predators quadrupled
Question 2
What is happening to the deer population between 2005 and 2010?
A it increases exponentially and then stabilizes
B it decreases and then stabilizes
C it stays about the same
D it plummets
Question 3
During the same period 2005 2010 what might have also happened to the number of deer hunting licenses?
A Less people wanted to hunt deer so they didn't buy a hunting license
B the graph goes up and then goes down so there are more people hunting deer
C the graph goes down so there are more wolves and ticks
D the graph is different so there is no change

Answers: 3
Other questions on the subject: Biology
Biology, 22.06.2019 00:10, breasiasamuel7053
Which is an example of a decomposer? a. bear b. algae c. grass d. bacteria d bacteria
Answers: 2
Biology, 22.06.2019 22:00, jacobrobles755
Conservationists to restore ecosystems. which activity will positively affect the abiotic conditions of an ecosystem?
Answers: 2
Biology, 22.06.2019 22:30, dominiqueallen23
Skulls of homo sapiens were found during an excavation. the skulls were preserved because the bodies were frozen. so, these fossils are ( 1 ) fossils. ( 1 ) a. mineralized b. mold c. original-tissue
Answers: 1
Do you know the correct answer?
Questions in other subjects:


Mathematics, 02.09.2020 05:01

Chemistry, 02.09.2020 05:01
Mathematics, 02.09.2020 05:01


