

Biology, 06.10.2020 15:01, milkshakegrande101
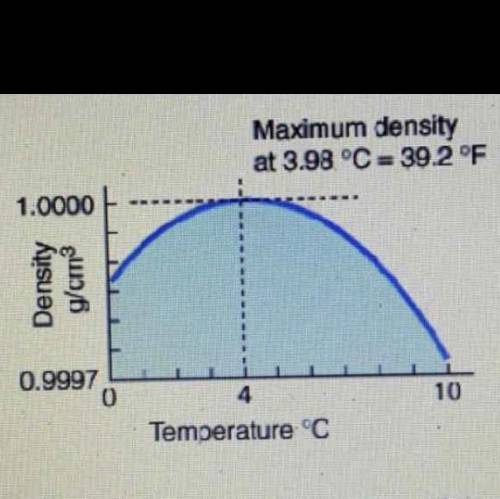
study figure 2. Ice cubes float in a glass of water and ponds / lakes freeze from the top down. use the data in the graph above to explain why this occurs.

Answers: 2


Other questions on the subject: Biology
Biology, 21.06.2019 21:00, alanrojas0142007
This is the diveristy of ecosystems natural communites and habits it is the variety of ways that species interact with each other and their environment
Answers: 1
Biology, 22.06.2019 02:30, vcwann6055
Which of these is most likely to happen if parallax measurements of star distances are taken after a gap of six months? the results would be accurate the results would be inconsistent the results would not be valid the results would not be repeated
Answers: 1
Biology, 22.06.2019 07:30, dobrzenski8372
Which of the following situations describes a adaptation for a mole? question 2 options: a mole is blind and cannot see underground. a mole is bright and attracts the attention of predator birds. a mole has a sensitive sense of smell to it find food underground.
Answers: 1
Biology, 22.06.2019 10:50, taliyahjhonson1
The carrier molecules of the electron transport system are located in the
Answers: 1
Do you know the correct answer?
study figure 2. Ice cubes float in a glass of water and ponds / lakes freeze from the top down. use...
Questions in other subjects:

Geography, 18.07.2019 02:50


