

Biology, 20.09.2020 19:01, HeyItsCookie9605
Select the correct answer.
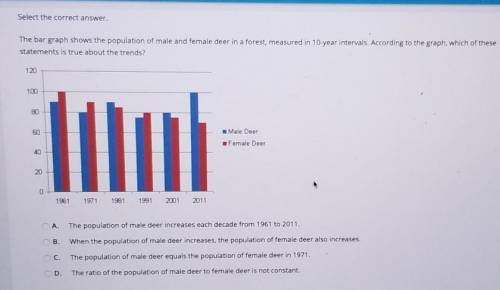
The bar graph shows the population of male and female deer in a forest, measured in 10-year intervals. According to the graph, which of these
statements is true about the trends?
120
100
80
60
Male Deer
Female Deer
40
20
0
1961
1971
1981
1991
2001
2011
A.
The population of male deer increases each decade from 1961 to 2011.
B.
When the population of male deer increases, the population of female deer also increases.
C.
The population of male deer equals the population of female deer in 1971.
D.
The ratio of the population of male deer to female deer is not constant.

Answers: 1


Other questions on the subject: Biology
Biology, 21.06.2019 23:00, akbogg3893
Based on the data in your tables, did the light-colored moths have a higher or lower survival rate after the industrial revolution?
Answers: 2
Biology, 22.06.2019 07:30, stefkellum58
Match the reproductive structures based on their function and the system to which they belong. egg ovary sperm vas deferens vagina fallopian tube testis urethra
Answers: 1
Biology, 22.06.2019 08:00, ladypink94
Can create a hboth of these instruments can measure wind speed. doppler radar and psychrometer anemometer and hygrometer doppler radar and anemometer radiosonde and psychrometer
Answers: 3
Biology, 22.06.2019 08:00, friskisthebest1
As the pea seeds respire, the level of coloured liquid in the left hand part of the capillary tube rises. by referring to what is happening in the apparatus, explain why the level of liquid changes
Answers: 3
Do you know the correct answer?
Select the correct answer.
The bar graph shows the population of male and female deer in a forest...
Questions in other subjects:


Mathematics, 17.09.2019 15:30


Chemistry, 17.09.2019 15:30

Biology, 17.09.2019 15:30


