

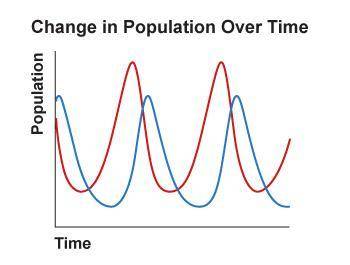
Which relationship is shown in the graph? A graph entitled Change in Population Over Time shows Time on the horizontal axis and population on the vertical axis. 2 different curves are shown. They follow the same trend, but one curve hits the maximum point prior to the second curve. competitive exclusion relationship habitat-niche relationship biotic-abiotic relationship predator-prey relationship

Answers: 1


Other questions on the subject: Biology
Biology, 22.06.2019 01:30, eguilford4438
Scenario 5 1) take 10 red and 10 black beans and place them, mixed, on the table. record the starting phenotype # and frequencies (% of your total population) of your starting population in the table provided (generation 0). 2) act as a predator. “capture” as many organisms as you can until you have reduced the population to three organisms. put them aside. at this point, the predators die. 3) the remaining organisms each produce 2 clonal offspring. multiply your organisms accordingly and allow them to mix on the table. calculate and record the resultant phenotype # and frequencies (% of your total population) of your population in the table provided (generation 1). 4) repeat the reproduction event, allowing each of your organisms to produce 2 clonal offspring. calculate and record the resultant phenotype # and frequencies (% of your total population) of your population in the table provided (generation 2). 5) repeat the reproduction event, allowing each of your organisms to produce 2 clonal offspring. calculate and record the resultant phenotype # and frequencies (% of your total population) of your population in the table provided (generation 3).
Answers: 1
Biology, 22.06.2019 02:00, aredding7016
The accompanying figure shows the percent of selected dna sequences that match between a chimpanzee and other primates. these data support the hypothesis that the figure shows the percentage of selected d n a sequences that match between the chimpanzee and other primates. the human has an almost 98 percent match, the gorilla has an almost 97 percent match, the orangutan has a 96 percent match, the gibbon has an almost 95 percent match, and the old world monkey has an almost 92 percent match. the accompanying figure shows the percent of selected dna sequences that match between a chimpanzee and other primates. these data support the hypothesis that the figure shows the percentage of selected d n a sequences that match between the chimpanzee and other primates. the human has an almost 98 percent match, the gorilla has an almost 97 percent match, the orangutan has a 96 percent match, the gibbon has an almost 95 percent match, and the old world monkey has an almost 92 percent match. chimpanzees and gibbons are the most closely related the chimpanzee's closest surviving relative is humans orangutans are the primates least closely related to chimpanzees old world monkeys and gibbons are the most closely related
Answers: 1
Biology, 22.06.2019 04:40, 2016gbryant
Hurry where is the majority of earth's water found? o glaciers o oceans ground o rivers and lakes
Answers: 1
Do you know the correct answer?
Which relationship is shown in the graph?
A graph entitled Change in Population Over Time shows Tim...
Questions in other subjects:

Spanish, 06.01.2020 12:31

Mathematics, 06.01.2020 12:31


History, 06.01.2020 12:31

Arts, 06.01.2020 12:31
History, 06.01.2020 12:31


