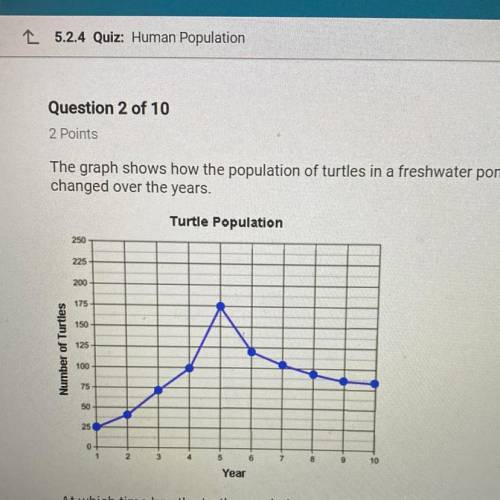
The graph shows how the population of turtles in a freshwater pond has
changed over the years.
Turtle Population
Number of Turtles
Year
At which time has the turtle population reached the carrying capacity of the
pond?
O A. Year 3
O B. Year 1
O C. Year 5
O D. Year 10


Answers: 3
Other questions on the subject: Biology


Biology, 22.06.2019 18:30, iwannabewinston
In two sentences explain the differences of neutrophil and macrophage
Answers: 1


Biology, 22.06.2019 23:30, theoriginalstal4234
What is the tern used to describe an individual that of a recessive allele that causes disease, but is otherwise healthy? a. carrier b. polycite c. target d. afflicted
Answers: 1
Do you know the correct answer?
The graph shows how the population of turtles in a freshwater pond has
changed over the years.
Questions in other subjects:

Mathematics, 02.07.2020 18:01

Mathematics, 02.07.2020 18:01

Mathematics, 02.07.2020 18:01

History, 02.07.2020 18:01


