

Biology, 18.06.2020 09:57, maddy121209
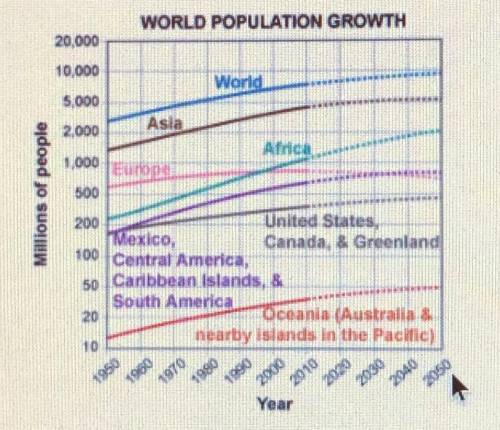
What does the graph predict about the world in the year 2050?
A. The carrying capacity will decrease quickly.
B. Earth's population will increase quickly.
C. The fertility rate on Earth will be very low.
D. The birthrate and death rate will be nearly equal.

Answers: 3


Other questions on the subject: Biology
Biology, 22.06.2019 05:30, KArrington815
The carbon cycle is best defined as a process in which a. carbon changes from inorganic forms to organic forms and back b. carbon is changed into other elements such as oxygen or nitrogen c. carbon is continually created from the sun’s energy by plants d. carbon is consumed and regenerated from other elements such as oxygen and nitrogen
Answers: 1
Biology, 22.06.2019 06:30, atiyawhite7863
Step 1 review the imaginary strand of dna below. note the complementary base pairs. a g c a a t c c g t c t t g g t c g t t a g g c a g a a c c step 2 to begin replicating this strand of dna, draw the two sides of the strand separating. step 3 now, draw the free-floating bases linking up with the separate sides. remember to follow the rules of complementary base pairing. step 4 draw the two resulting dna strands.
Answers: 1
Biology, 22.06.2019 11:00, ellieballinger9364
3what is the range of the function shownin the graph? ucation solutionsnw novo-9-8-7 -6 -5 -4 -3 -2 -1123456789
Answers: 1
Do you know the correct answer?
What does the graph predict about the world in the year 2050?
A. The carrying capacity will decreas...
Questions in other subjects:


World Languages, 03.04.2021 18:50
History, 03.04.2021 18:50

Mathematics, 03.04.2021 18:50

English, 03.04.2021 18:50
English, 03.04.2021 18:50

Social Studies, 03.04.2021 18:50


