

Biology, 18.06.2020 02:57, jamesgotqui6
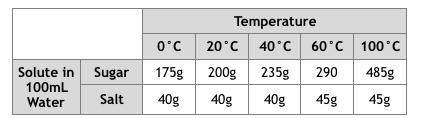
Use this data table to make a Solubility Curve (double line graph) for both sugar and table salt. Create the graph in the space below. Include the following on your graph: Title, axes labels, appropriate spacing, key.


Answers: 1


Other questions on the subject: Biology
Biology, 22.06.2019 00:30, chrisholmes176
Building glycogen from glucose molecules is an example of what
Answers: 2
Biology, 22.06.2019 02:00, karlaaag
Which statements describe resources? one of the factors people use when deciding where they will live is the availability of resources. renewable resources have little value for people. resources are unevenly distributed throughout the world. energy is the world resource which has the highest use. the use of nonrenewable resources has decreased in recent history. the use of resources is evenly distributed throughout the world. the world's oil supply will last for the next forty years if its use continues as expected.
Answers: 3
Biology, 22.06.2019 07:50, Mrblunt5613
What is a limitation of using a chemical formula, such as c6h1206, to represent a compound? the chemical formula does not show the types of elements that make up the compound. the chemical formula does not show how the atoms are connected to one another the chemical formula does not show the number of atoms of each element in a molecule. the chemical formula does not show the chemical symbols of the elements in the compound
Answers: 1
Do you know the correct answer?
Use this data table to make a Solubility Curve (double line graph) for both sugar and table salt. Cr...
Questions in other subjects:

Chemistry, 30.03.2020 16:44


Chemistry, 30.03.2020 16:44


