

Biology, 25.05.2020 00:00, ErnieIrwin
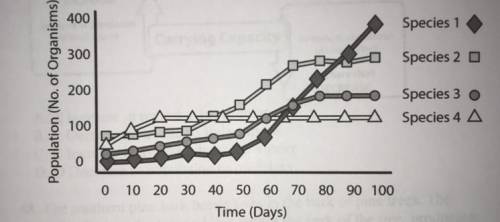
The graph provided shows the change in size of four populations introduced into a new habitat. Which population was the first to reach the limit of the capacity of this habitat to support it?
A. Species 1
B. Species 2
C. Species 3
D. Species 4

Answers: 3


Other questions on the subject: Biology
Biology, 21.06.2019 16:00, tristenmathews
Afarmer has applied a pesticide to control a pest population that is affecting her crops. the pest population has reacted as shown below. which best describes the process that the pest population has experienced due to this environmental change? a genetic diversity b natural selection c natural resistance d genetic resistance
Answers: 1
Biology, 21.06.2019 20:00, latinotimo4890
What volume of a 0.25 m solution can be made using 0.55 moles of ca(oh)2
Answers: 1
Biology, 22.06.2019 06:10, thompsonhomes1
The normal shape of an enzyme is as shown in structure a. if the enzyme’s shape changes to that shown in structure b, what are two consequences of this change?
Answers: 1
Biology, 22.06.2019 10:50, goodluck99
What is it called when part of a cell membrane closes around a molecule to allow the molecule to enter the cell? a. passive transport b. diffusion c. endocytosis d. exocytosisc. endocytosis
Answers: 2
Do you know the correct answer?
The graph provided shows the change in size of four populations introduced into a new habitat. Which...
Questions in other subjects:

Chemistry, 08.07.2019 03:00


Biology, 08.07.2019 03:00


