

Biology, 22.05.2020 18:01, blairjaneaoyrfvp
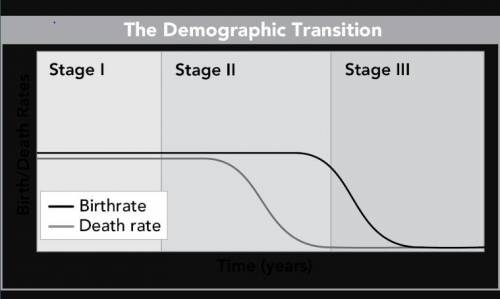
59. Demographers use graphs like this one to analyze patterns of population growth and decline.
The graph plots birthrate and death rate over time, in years. In Stage I, both rates begin relatively high. In Stage II, birth rate remains high while death rate decreases. At the end of Stage II and into Stage III, birthrate decreases to match the low death rate.
Suzie studies the graph and concludes that in Stage I and at the end of Stage III, the population of a country either is not changing size or is increasing slightly. Which assumption is necessary for Suzie’s conclusion to be accurate?
A. The population of the country did not increase substantially during Stage II.
B. The population of the country increased at least slightly during Stage II.
C. The population has a roughly equal distribution of people in age groups from ages 0 to 60 years.
D. The difference between the rates of immigration and emigration is insignificantly small.

Answers: 2


Other questions on the subject: Biology
Biology, 22.06.2019 12:00, nyceastcoast
Which are evidence of seafloor spreading? check all that apply. molten material magnetic stripes continent material drilled core samples ocean water samples
Answers: 1
Do you know the correct answer?
59. Demographers use graphs like this one to analyze patterns of population growth and decline.
Questions in other subjects:


Mathematics, 22.01.2021 01:00

History, 22.01.2021 01:00

History, 22.01.2021 01:00
Mathematics, 22.01.2021 01:00
Biology, 22.01.2021 01:00


